

Question: there are three problems. Problem 1 (worth 2%) The following data represent the heights of five 3-year-old leyland cypress trees growing in South America and
there are three problems.
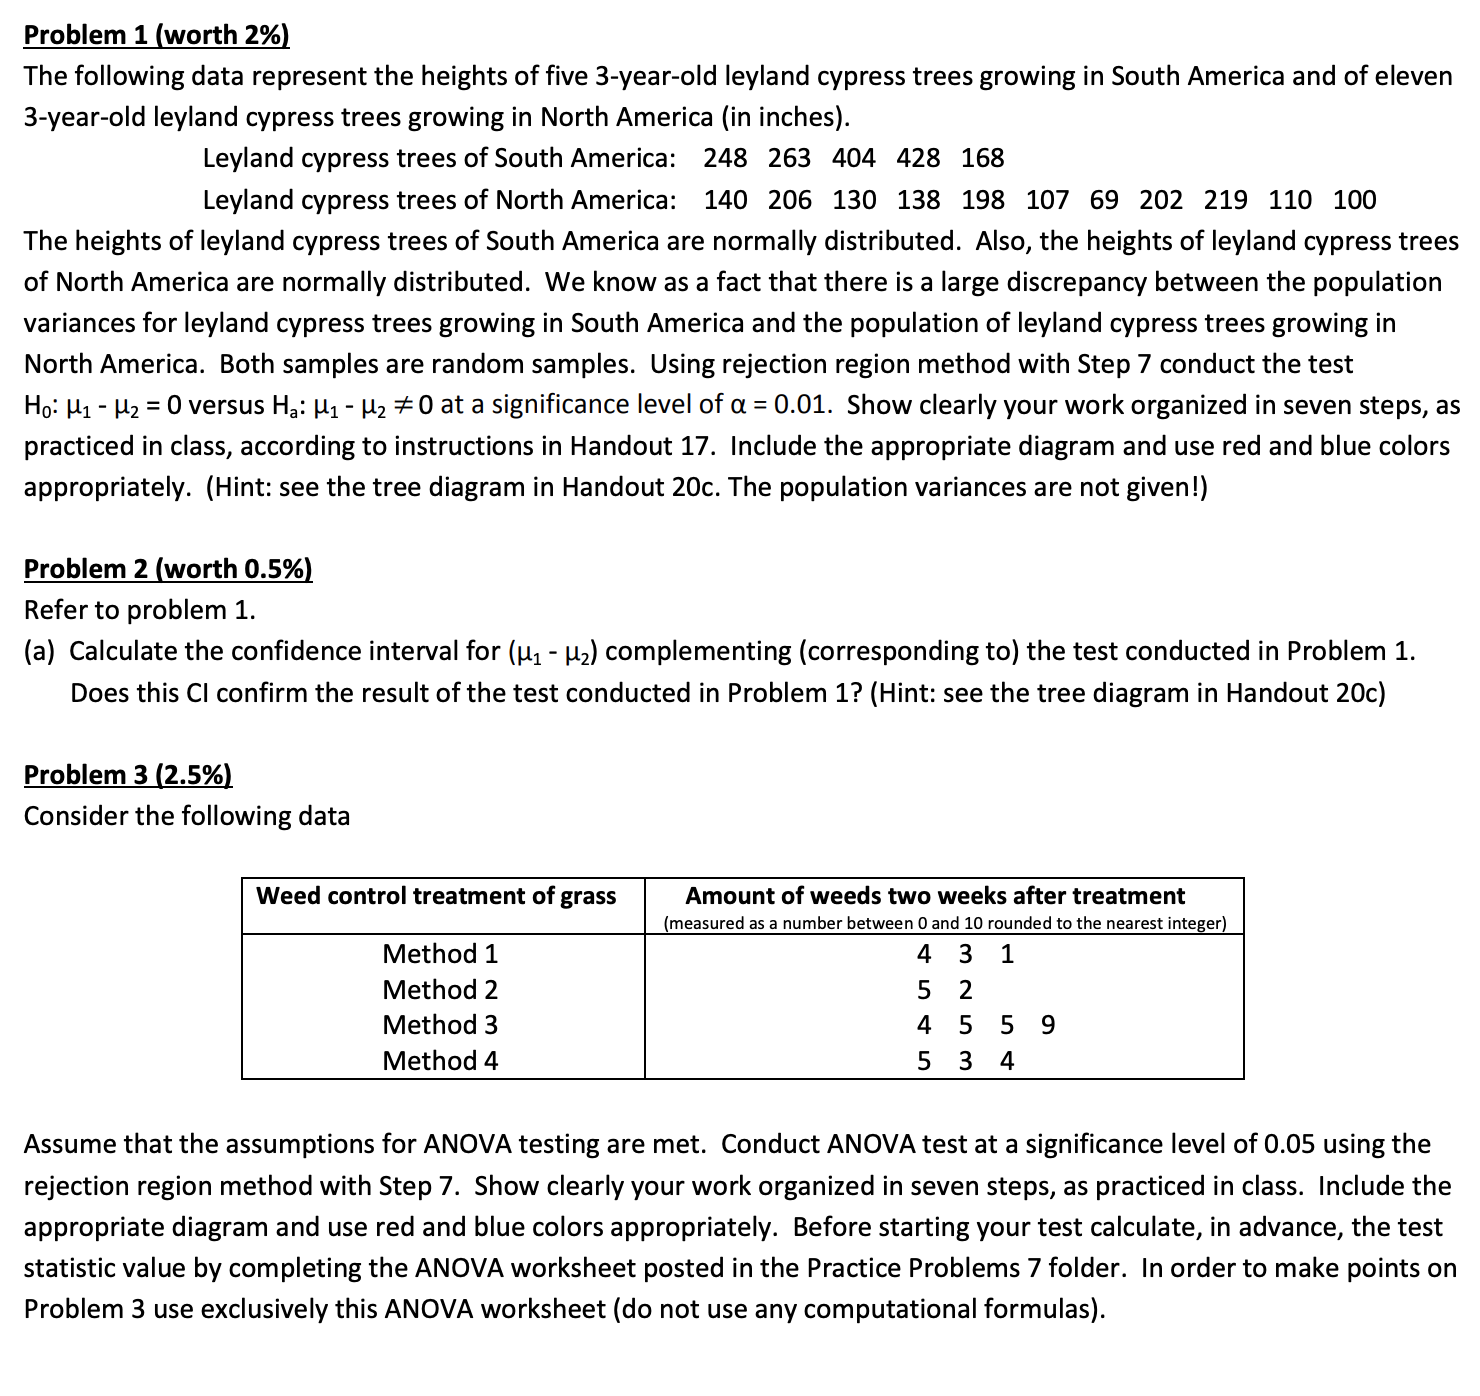
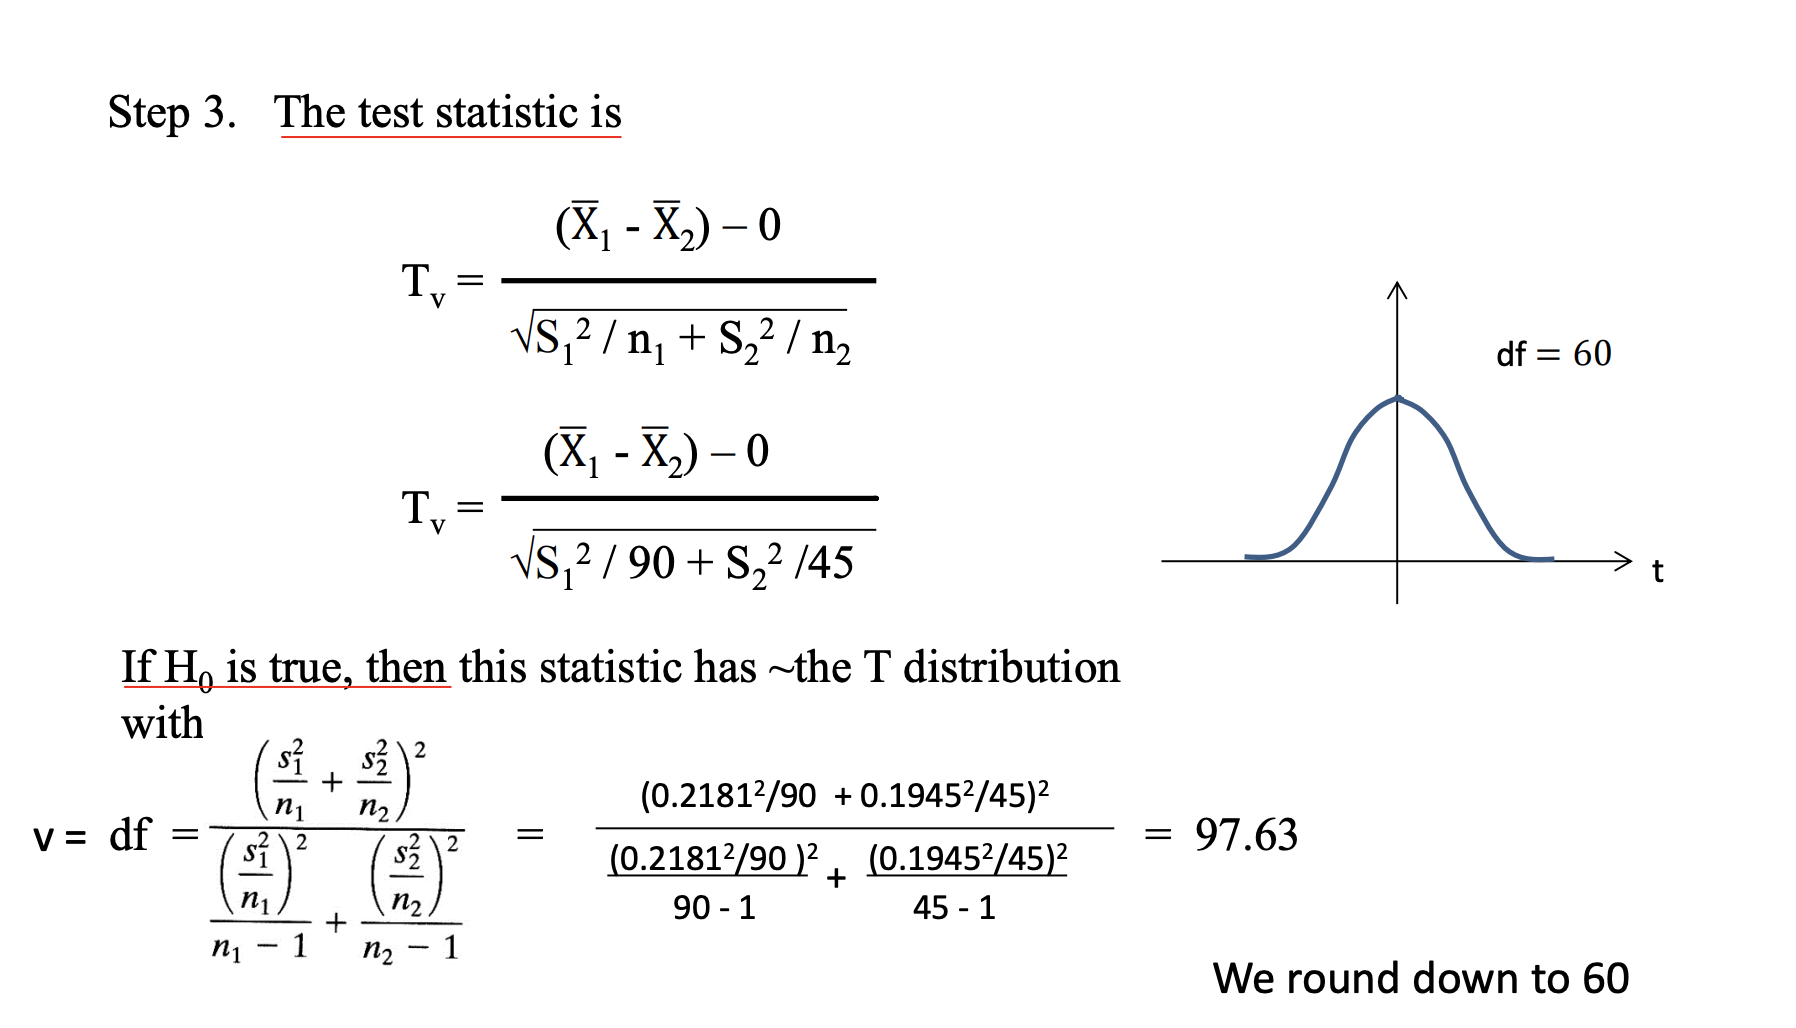
Problem 1 (worth 2%) The following data represent the heights of five 3-year-old leyland cypress trees growing in South America and of eleven 3-year-old leyland cypress trees growing in North America (in inches). Leyland cypress trees of South America: 248 263 404 428 168 Leyland cypress trees of North America: 140 206 130 138 198 107 69 202 219 110 100 The heights of leyland cypress trees of South America are normally distributed. Also, the heights of leyland cypress trees of North America are normally distributed. We know as a fact that there is a large discrepancy between the population variances for leyland cypress trees growing in South America and the population of leyland cypress trees growing in North America. Both samples are random samples. Using rejection region method with Step 7 conduct the test H0: pl - l-lz = 0 versus Ha: p1 - H2 at 0 at a significance level of Ct = 0.01. Show clearly your work organized in seven steps, as practiced in class, according to instructions in Handout 17. Include the appropriate diagram and use red and blue colors appropriately. (Hint: see the tree diagram in Handout 20c. The population variances are not given!) Problem 2 (worth 0.5%) Refer to problem 1. (a) Calculate the confidence interval for (pl - llzl complementing (corresponding to) the test conducted in Problem 1. Does this Cl confirm the result of the test conducted in Problem 1? (Hint: see the tree diagram in Handout 20c) Problem 3 (2.5%) Consider the following data Weed control treatment of grass Amount of weeds two weeks after treatment (measured as a number between 0 and 10 rounded to the nearest inteer) Method 1 4 3 1 Method 2 5 2 Method 3 4 5 Method 4 5 3 9 5 4 Assume that the assumptions for ANOVA testing are met. Conduct ANOVA test at a significance level of 0.05 using the rejection region method with Step 7. Show clearly your work organized in seven steps, as practiced in class. Include the appropriate diagram and use red and blue colors appropriately. Before starting your test calculate, in advance, the test statistic value by completing the ANOVA worksheet posted in the Practice Problems 7 folder. In order to make points on Problem 3 use exclusively this ANOVA worksheet (do not use any computational formulas). Step 3. The test statistic is ( X1 - X2) - 0 T. = VS, 2 / n + S2 2 / n2 df = 60 ( X1 - X2) - 0 T. = VS, 2 / 90 + S,2 /45 t If He is true, then this statistic has ~the T distribution with 2 n n2 (0.21812/90 + 0.19452/45)2 v = df = 2 = 97.63 S2 (0.21812/90 )2 (0.19452/45)2 n1 n2 90 - 1 45 - 1 n1 1 n2 - We round down to 60
Step by Step Solution
There are 3 Steps involved in it

Get step-by-step solutions from verified subject matter experts