Question: There are too many pages for chapter 3. Here are some pages for it. I think, these are relevant. Q1. Consider the problem described in
 There are too many pages for chapter 3. Here are some pages for it. I think, these are relevant.
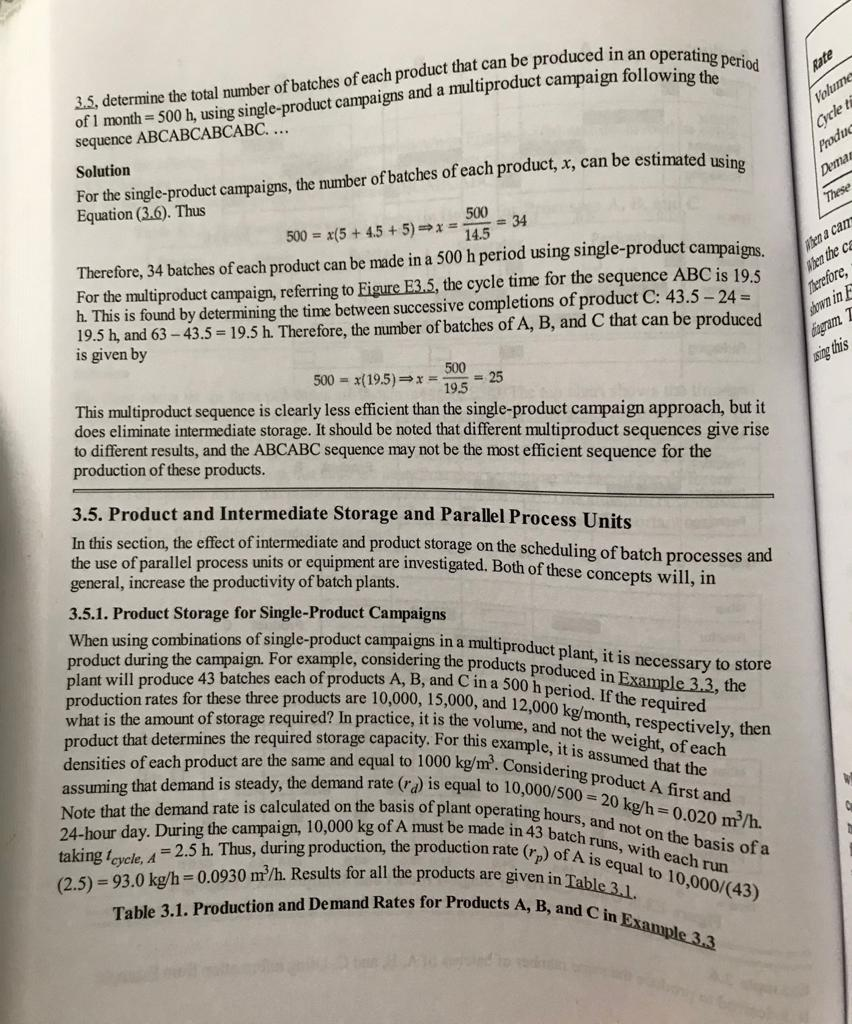
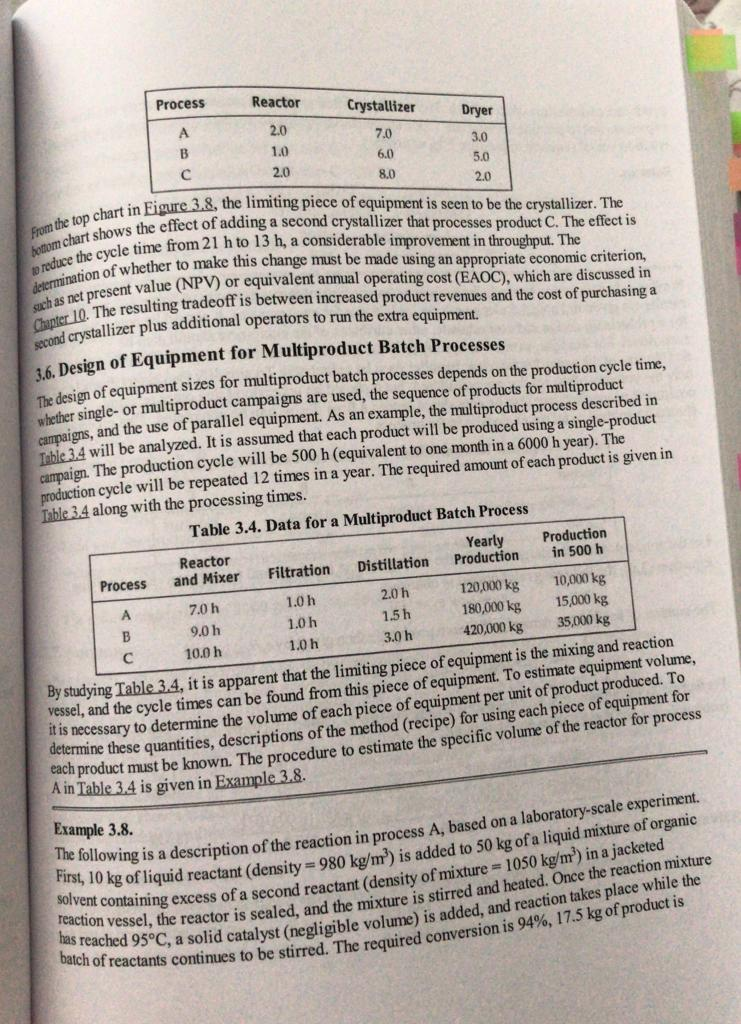
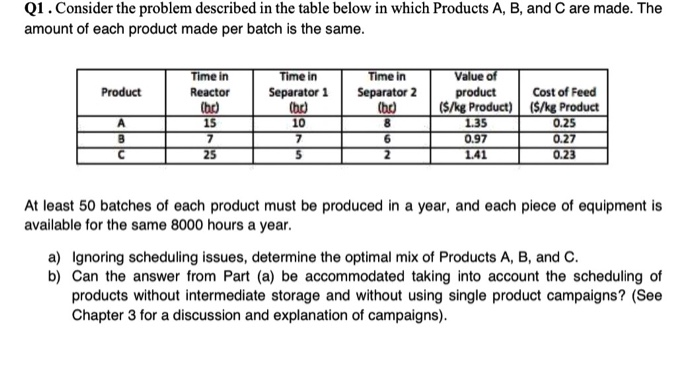
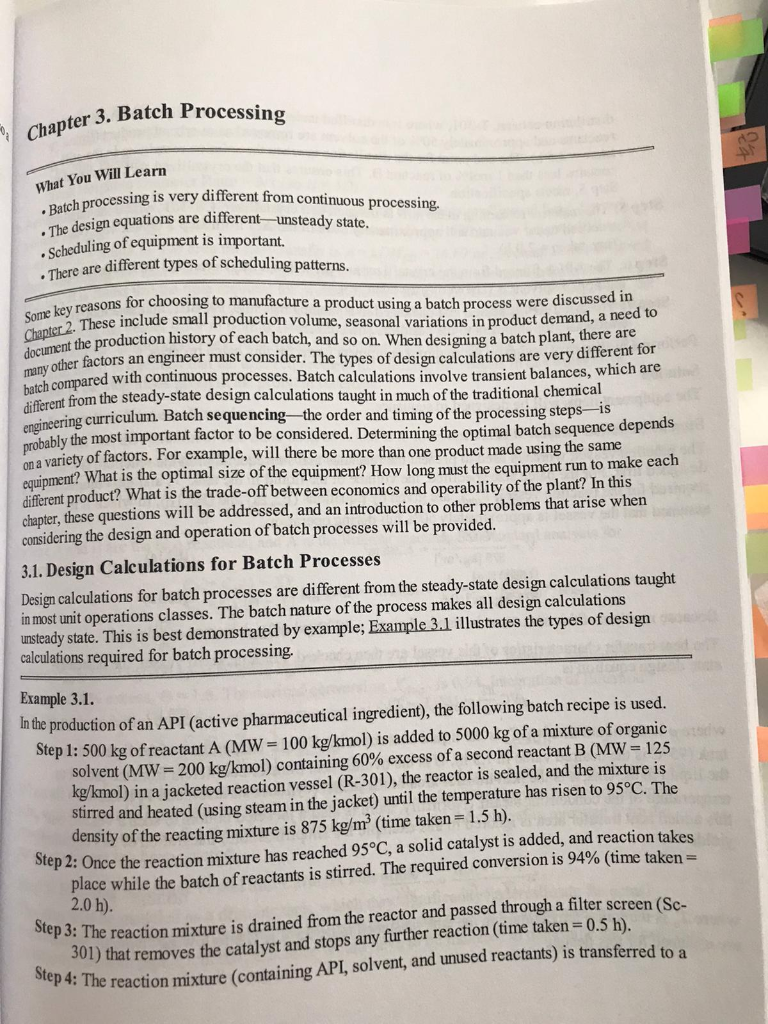
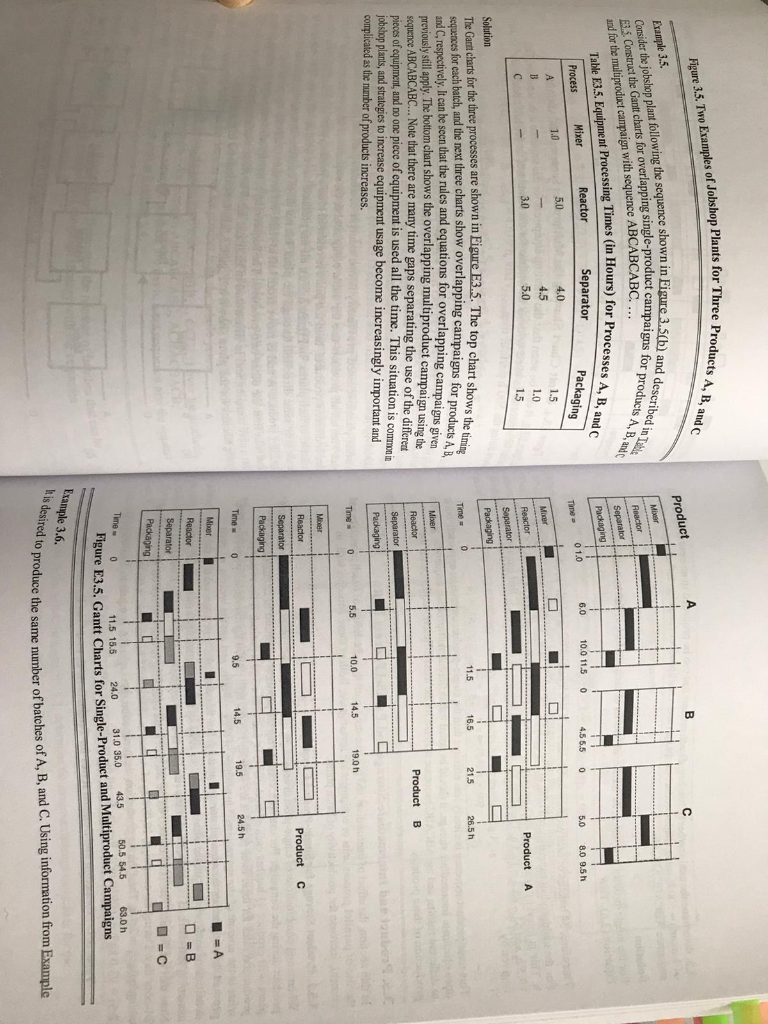
Q1. Consider the problem described in the table below in which Products A, B, and C are made. The amount of each product made per batch is the same. Time in Time in Time in Product Reactor Separator 1 Cho Cho (hd) A 15 8 B776 C255 2 Value of product ($/kg Product) 1.35 0.97 1 .41 10 Cost of Feed ($/kg Product 0.25 0.27 0.23 At least 50 batches of each product must be produced in a year, and each piece of equipment is available for the same 8000 hours a year. a) Ignoring scheduling issues, determine the optimal mix of Products A, B, and C. b) Can the answer from Part (a) be accommodated taking into account the scheduling of products without intermediate storage and without using single product campaigns? (See Chapter 3 for a discussion and explanation of campaigns). ter 3. Batch Processing Chapter 3. Batch What You Will Learn Batch processing is very The design equations processing is very different from continuous processing. design equations are differentunsteady state. Scheduling of equipment is important. re are different types of scheduling patterns. Some key reasons for Chapter 2. These in document the productie many other factors ar reasons for choosing to manufacture a product using a batch process were discussed These include small production volume, seasonal variations in product demand, a need the production history of each batch, and so on. When designing a batch plant, there are ther factors an engineer must consider. The types of design calculations are very different compared with continuous processes. Batch calculations involve transient balances, which are rent from the steady-state design calculations taught in much of the traditional chemical ineering curriculum. Batch sequencing the order and timing of the processing stepsIS robably the most important factor to be considered. Determining the optimal batch sequence depends a variety of factors. For example, will there be more than one product made using the same quipment? What is the optimal size of the equipment? How long must the equipment run to make each different product? What is the trade-off between economics and operability of the plant? In this chapter, these questions will be addressed, and an introduction to other problems that arise when considering the design and operation of batch processes will be provided. 3.1. Design Calculations for Batch Processes Design calculations for batch processes are different from the steady-state design calculations taught in most unit operations classes. The batch nature of the process makes all design calculations unsteady state. This is best demonstrated by example; Example 3.1 illustrates the types of design calculations required for batch processing. Example 3.1. In the production of an API (active pharmaceutical ingredient), the following batch recipe is used. Step 1: 500 kg of reactant A (MW= 100 kg/kmol) is added to 5000 kg of a mixture of organic solvent (MW= 200 kg/kmol) containing 60% excess of a second reactant B (MW= 125 kg/kmol) in a jacketed reaction vessel (R-301), the reactor is sealed, and the mixture is stirred and heated (using steam in the jacket) until the temperature has risen to 95C. The density of the reacting mixture is 875 kg/m (time taken=1.5 h). Step 2: Once the reaction mixture has reached 95C, a solid catalyst is added, and reaction takes place while the batch of reactants is stirred. The required conversion is 94% (time taken = 2.0 h). rep 3: The reaction mixture is drained from the reactor and passed through a filter screen (Se 301) that removes the catalyst and stops any further reaction (time taken = 0.5 h). the reaction mixture (containing API, solvent, and unused reactants) is transferred Step 4: The reacti for Three Products A, B, and Figure 3.5. Two Examples of Jobshop Plants for Th Product Example 3.5. in Figure 3.5(b) and described i le-product campaigns for products A cribed in The oducts A, B, Consider the jobshop plant following the sequence shown in Figure 3.5. Construct the Gantt charts for overlapping single-product and for the multiproduct campaign with sequence ABCABCABC.. Table E3.5. Equipment Processing Times (in Hours) Separator Processes A, B, and Packaging Packaging Mixer Reactor Separator 6.0 01. 06. 01 10.0 11. 5 0 4.5 6. 5 0 Process 5.0 8.0 9.5 h Time 1.0 5.0 4.0 4.5 1.5 Mixer 1.0 3.0 5.0 Reactor Product A 1.5 Separator Packaging 3.5. The top chart shows the timing campaigns for products A, B, 11.5 16.5 21.5 26.5 h Time Mixer Solution The Gantt charts for the three processes are shown in Figure E3.5. The top chart show sequences for each batch, and the next three charts show overlapping campaigns for pro and respectively. It can be seen that the rules and equations for overlapping campaigns previously still apply. The bottom chart shows the overlapping multiproduct campaign using the sequence ABCABCABC... Note that there are many time gaps separating the use of the different pieces of equipment, and no one piece of equipment is used all the time. This situation is common in jobshop plants, and strategies to increase equipment usage become increasingly important and complicated as the number of products increases. Reactor Product B Separator Packaging 10.0 14.5 19.0 h Time Mizer Reactor Product C Separator Packaging Time 14.5 19.5 24.5 h Mber Reactor = A =B = C Separator Packaging Time - 0 11.5 10 11.5 15.5 24.0 31.0 35.0 43.5 50.5 54.5 63.0 h Figure E3.5. Gantt Charts for Single Product and Multiproduct Campaigns Example 3.6. His desired to pro od to produce the same number of batches of A, B, and C. Using information from Example ced in an operating period rate Volume 3.5. determine the total number of batches of each product that can be produced in an operati of 1 month = 500 h, using single-product campaigns and a multiproduct campaign following sequence ABCABCABCABC. ... Cycle Produs Demar These 500-34 Solution For the single-product campaions the mimber of batches of each product, x, can be estimated using Equation (3.6). Thus 500 = x(5 + 4.5 + 5) => x = 14.5 = 34 Therefore, 34 batches of each product can be made in a 500 h period using single-product campaigns For the multiproduct campaign, referring to Figure E3.5, the cycle time for the sequence ABC is 19.5 h. This is found by determining the time between successive completions of product C: 43.5 - 24 = 19.5 h, and 63 - 43.5 = 19.5 h. Therefore, the number of batches of A, B, and C that can be produced is given by na carr When the ca Merefore, shown in diagram 7 wing this 50025 500 = x(19.5) = x= 105 - 25 This multiproduct sequence is clearly less efficient than the single-product campaign approach, but it does eliminate intermediate storage. It should be noted that different multiproduct sequences give rise to different results, and the ABCABC sequence may not be the most efficient sequence for the production of these products. 3.5. Product and Intermediate Storage and Parallel Process Units In this section, the effect of intermediate and product storage on the scheduling of batch processes and rocess units or equipment are investigated. Both of these concepts will, in general, increase the productivity of batch plants. 3.5.1. Product Storage for Single Product Campaigns product during the campaign. For example, considering the products plant will produce 43 batches each of products A, B, and C in a 500 h Derin production rates for these three products are 10,000, 15,000, and 12.00 what is the amount of storage required? In practice, it is the volume an product that determines the required storage capacity. For this exam densities of each product are the same and equal to 1000 kg/m3. Coneia assuming that demand is steady, the demand rate (ra) is equal to 10,000 Note that the demand rate is calculated on the basis of plant operating 24-hour day. During the campaign, 10,000 kg of A must be made in 431 taking =2.5 h. Thus, during production, the production rate (r) (2.5) = 93.0 kg/h=0.0930 m3/h. Results for all the pr Table 3.1. Production and Demand Rates for Products A, B. product campaigns in a multiproduct plant, it is necessary to store e, considering the products produced in Example 3.3, the B. and C in a 500 h period. If the required 10.000, 15,000, and 12,000 kg/month, respectively, then it is the volume, and not the weight, of each city. For this example, it is assumed that the okam. Considering product A first and equal to 10,000/500 = 20 kg/h=0.020 m/h. at operating hours, and not on the basis of a e in 43 batch runs, with each run rate (r) of A is equal to 10,000/(43) given in Table 3.1. A, B, and C in Example 3.3 erating periods ing the Product Product B Product ated using Rate Volume (m) of prod Cycle time (h) m) of product required per month 10,0 2.5 (10)/I(43)(2.5)) = 0.0930 (10)/(500) - 0.020 pproximate cycle times based on Equation (3.5). Production rate, r, (m/h) Demand rate, , (m/h) These are approximate cycle tin 15.0 4.5 0.07752 0.030 12.0 4.5 0.06202 0.024 campaigns. BC is 19.5 5 - 24 produced When a campaign for a p When the campaign has sto Therefore, the accumulati shown in Figure 3.6. Th diagram The maximum using this single-product for a product is running, the rate of production is greater than the demand rate. on has stopped, the demand rate is greater than the production rate of zero. accumulation and depletion of product over the monthly period are similar to those 3.6. The changing inventory of material is represented on this figure by the bottom maximum inventory, V, is the minimum storage capacity that is required for the product indle-product campaign strategy. The expression for calculating V.is V = (r-ratam ach, but it give rise Demand Rates Volume of Product Production and s sses and Slope = 1,- Slope =- Campaign Time Nonproduction Time Zo store the y, then Total Time = 1 Month Figure 3.6. Changing Inventory of Product during Single Product Campaign Run within a Multiproduct Process le can is the campaign time. This assumes that the shipping rate of product from the plant is uring plant operating hours. Because shipping is usually itself a batch process, the actual formam.orage capacity could be more or less than that calculated in Equation (3.7). The strategies shipping schedules to minimize cost (including storage costs and missed-delivery risks) wn as logistics and are not covered here. n of the minimum storage capacities for all products in Example 3.3 is given in Example constant during plant ope minimum storage cap for matching shipping sch m/h. sofa are known as logisu Determination of the minimu -43) Example 3.7. For the products A, B, and Single-product campaig -B, and C in Example 3.3, determine the minimum storage capacities for the det campaign strategy outlined in Example 3.3. V. (m) Solution Table E3.7 shows the results using data given in Example 22 Storage Volume from Equation (3.7 Table E3.7. Results for the Estimation of Minimum Storage Volume from Equatio Product Campaign Time, t. (h) - (m/h) (43)(2.5) = 107.5 009302 -0.020 = 0.07302 (0.07302)(107.5) = 7.85 (43)(4.5) - 193.5 0.07752 -0.030 = 0.04752 (0.04752)(193.5) = 920 (43)(4.5) = 193.5 0.06202 -0.024 = 0.03802 (0.03802)(193.5) = 7.36 It should be noted that the production cycle time is equal to the sum of the campaign times, or (1075 + 193.5+ 193.5) = 494.5 h, which is slightly less than 500 h. This discrepancy reflects the approximation of cycle times given by Equation (3,6). The actual cycle times for A, B, and Care found from Example 3.3 and are equal to 2.63, 4.62, and 4.65 h, respectively. The corresponding values of V, are 7.79, 9.18, and 7.31 m. Clearly, these differences are small, and the approach using Equation (3.6) is acceptable when the number of production runs per campaign is 10 or more. 3.5.2. Intermediate Storage Up to this point, it has been assumed that there is no intermediate product storage available. This type of process is also known as a zero wait, or a zw process [4]. Specifically, as soon as a unit operation is completed, the products are transferred to the next unit operation in the sequence, or they go to final product storage. The concept of storing the final product to match the supply with the demand was demonstrated in Example 3.7. However, it may also be beneficial to store the output from a given piece of equipment for a period of time to increase the overall efficiency of a process. It may be possible to store product in the equipment that has just been used. For example, if two feed streams are mixed in a vessel, the mixture could be stored until the next process unit in the production sequence becomes available. In this case, the storage time is limited based on the scheduline of This holding-in-place method may not work for some unit operations. For example, in a reactor, a side reaction may take place, and unless the reaction can be anen v take place, and unless the reaction can be quenched, the product yield and selectivity will suffer. The upper limit of the intermediate storage ca will suffer. The upper limit of the intermediate storage concept occurs when there is unlimited intermediate storage (uis) available, and this is referred to available, and this is referred to as a uis process [4]. In d when intermediate product storage is available. This concept is formation given in Table 3.2 illustrated in Figure 3.7, which is based on the information given in Tab Reactor Crystallizer Dryer 0 Time 19 23 25 27 30 h Reactor Chystallizer Dryer Time 02 7 9 12 16 19 23 30 33 h 26 = 14 h Reactor Crystallizer Dryer Time 0 2 7 9 11 1922 27 30 33 h = 11 h Figure 3.7. Multiproduct Sequence (ABC) for Products Given in Table 3.2 Showing Effect of Intermediate Storage (Storage Shown as Circles; Number Identifies Individual Tanks for Each Intermediate Product) Table 3.2. Equipment Times (in Hours) Required for Products A, B, and C Product Reactor Crystallizer Dryer Total 2.0 5.0 2.0 9.0 6.0 4.0 4.0 14.0 2.0 2.0 7.0 Total Time per Equipment 10.0 11.0 ediate product storage, the shortest multiproduct campaign, as given by Equation (3.6), wn in Figure 3.7. However, if the materials leaving the reactor and crystallizer are prior to transfer to the crystallizer and dryer, respectively, then this time is reduced limiting cycle time for a uis process is given by 3.0 9.0 Without intermediate produ 14 h, as shown in Figure placed in storage prior to 11 h. The limiting cyc (3.8) = max nca fucks- 11 equence. For the case shown in Table 3.2 cause only one campaign for each product (A, B, and C) is used in the rem is the number of unit operations, N is the number of produ Faroduct i produced in a single multiproduct sequence. For the case shown campaigns of product i produced in a single m and Figure 3.7.= 1 (because only one campa ultiproduct sequence), and Equation (3.8) is the maximum or 11.0 h The total amount of storage required for this exam vessels are required, each dedicated to one interm storage required for this example is fairly small, because only three storage each dedicated to one intermediate product. The downside of this approach is many more material transfers required, and the potential for product contamination and operator error increases significantly. 3.5.3. Parallel Process Units Another strategy that can be employed to increase production is to use duplicate equipment. This strategy is most beneficial when there is a bottleneck involving a single piece of equipment that can be relieved by adding a second (or more) units in parallel. This strategy can be extended to a limiting case in which parallel trains of equipment are used for each product. This strategy eliminates the dependence of scheduling between the different products but is more expensive, because the number of pieces of equipment increases m-fold, where m is the number of products. An example of using parallel equipment is shown in Figure 3.8 based on the data in Table 3.3. Reactor Crystallizer Dryer Time 02 8 9 12 13 15 20 23 25 30 33 h ce = 21 h Reactor Crystallizer 1 Crystallizer 2 Dryer Time 0 2 4 8 9 121415 20 2 5 27 28 33 h = 13 h Figure 3.8. The Effect of Adding an Additional Crystallizer to the Process Given in To Table 3.2 Table 3.3. Data (Times in Hours) for Multiproduct Batch Process Shown in Figure 2 Q1. Consider the problem described in the table below in which Products A, B, and C are made. The amount of each product made per batch is the same. Time in Time in Time in Product Reactor Separator 1 Cho Cho (hd) A 15 8 B776 C255 2 Value of product ($/kg Product) 1.35 0.97 1 .41 10 Cost of Feed ($/kg Product 0.25 0.27 0.23 At least 50 batches of each product must be produced in a year, and each piece of equipment is available for the same 8000 hours a year. a) Ignoring scheduling issues, determine the optimal mix of Products A, B, and C. b) Can the answer from Part (a) be accommodated taking into account the scheduling of products without intermediate storage and without using single product campaigns? (See Chapter 3 for a discussion and explanation of campaigns). ter 3. Batch Processing Chapter 3. Batch What You Will Learn Batch processing is very The design equations processing is very different from continuous processing. design equations are differentunsteady state. Scheduling of equipment is important. re are different types of scheduling patterns. Some key reasons for Chapter 2. These in document the productie many other factors ar reasons for choosing to manufacture a product using a batch process were discussed These include small production volume, seasonal variations in product demand, a need the production history of each batch, and so on. When designing a batch plant, there are ther factors an engineer must consider. The types of design calculations are very different compared with continuous processes. Batch calculations involve transient balances, which are rent from the steady-state design calculations taught in much of the traditional chemical ineering curriculum. Batch sequencing the order and timing of the processing stepsIS robably the most important factor to be considered. Determining the optimal batch sequence depends a variety of factors. For example, will there be more than one product made using the same quipment? What is the optimal size of the equipment? How long must the equipment run to make each different product? What is the trade-off between economics and operability of the plant? In this chapter, these questions will be addressed, and an introduction to other problems that arise when considering the design and operation of batch processes will be provided. 3.1. Design Calculations for Batch Processes Design calculations for batch processes are different from the steady-state design calculations taught in most unit operations classes. The batch nature of the process makes all design calculations unsteady state. This is best demonstrated by example; Example 3.1 illustrates the types of design calculations required for batch processing. Example 3.1. In the production of an API (active pharmaceutical ingredient), the following batch recipe is used. Step 1: 500 kg of reactant A (MW= 100 kg/kmol) is added to 5000 kg of a mixture of organic solvent (MW= 200 kg/kmol) containing 60% excess of a second reactant B (MW= 125 kg/kmol) in a jacketed reaction vessel (R-301), the reactor is sealed, and the mixture is stirred and heated (using steam in the jacket) until the temperature has risen to 95C. The density of the reacting mixture is 875 kg/m (time taken=1.5 h). Step 2: Once the reaction mixture has reached 95C, a solid catalyst is added, and reaction takes place while the batch of reactants is stirred. The required conversion is 94% (time taken = 2.0 h). rep 3: The reaction mixture is drained from the reactor and passed through a filter screen (Se 301) that removes the catalyst and stops any further reaction (time taken = 0.5 h). the reaction mixture (containing API, solvent, and unused reactants) is transferred Step 4: The reacti for Three Products A, B, and Figure 3.5. Two Examples of Jobshop Plants for Th Product Example 3.5. in Figure 3.5(b) and described i le-product campaigns for products A cribed in The oducts A, B, Consider the jobshop plant following the sequence shown in Figure 3.5. Construct the Gantt charts for overlapping single-product and for the multiproduct campaign with sequence ABCABCABC.. Table E3.5. Equipment Processing Times (in Hours) Separator Processes A, B, and Packaging Packaging Mixer Reactor Separator 6.0 01. 06. 01 10.0 11. 5 0 4.5 6. 5 0 Process 5.0 8.0 9.5 h Time 1.0 5.0 4.0 4.5 1.5 Mixer 1.0 3.0 5.0 Reactor Product A 1.5 Separator Packaging 3.5. The top chart shows the timing campaigns for products A, B, 11.5 16.5 21.5 26.5 h Time Mixer Solution The Gantt charts for the three processes are shown in Figure E3.5. The top chart show sequences for each batch, and the next three charts show overlapping campaigns for pro and respectively. It can be seen that the rules and equations for overlapping campaigns previously still apply. The bottom chart shows the overlapping multiproduct campaign using the sequence ABCABCABC... Note that there are many time gaps separating the use of the different pieces of equipment, and no one piece of equipment is used all the time. This situation is common in jobshop plants, and strategies to increase equipment usage become increasingly important and complicated as the number of products increases. Reactor Product B Separator Packaging 10.0 14.5 19.0 h Time Mizer Reactor Product C Separator Packaging Time 14.5 19.5 24.5 h Mber Reactor = A =B = C Separator Packaging Time - 0 11.5 10 11.5 15.5 24.0 31.0 35.0 43.5 50.5 54.5 63.0 h Figure E3.5. Gantt Charts for Single Product and Multiproduct Campaigns Example 3.6. His desired to pro od to produce the same number of batches of A, B, and C. Using information from Example ced in an operating period rate Volume 3.5. determine the total number of batches of each product that can be produced in an operati of 1 month = 500 h, using single-product campaigns and a multiproduct campaign following sequence ABCABCABCABC. ... Cycle Produs Demar These 500-34 Solution For the single-product campaions the mimber of batches of each product, x, can be estimated using Equation (3.6). Thus 500 = x(5 + 4.5 + 5) => x = 14.5 = 34 Therefore, 34 batches of each product can be made in a 500 h period using single-product campaigns For the multiproduct campaign, referring to Figure E3.5, the cycle time for the sequence ABC is 19.5 h. This is found by determining the time between successive completions of product C: 43.5 - 24 = 19.5 h, and 63 - 43.5 = 19.5 h. Therefore, the number of batches of A, B, and C that can be produced is given by na carr When the ca Merefore, shown in diagram 7 wing this 50025 500 = x(19.5) = x= 105 - 25 This multiproduct sequence is clearly less efficient than the single-product campaign approach, but it does eliminate intermediate storage. It should be noted that different multiproduct sequences give rise to different results, and the ABCABC sequence may not be the most efficient sequence for the production of these products. 3.5. Product and Intermediate Storage and Parallel Process Units In this section, the effect of intermediate and product storage on the scheduling of batch processes and rocess units or equipment are investigated. Both of these concepts will, in general, increase the productivity of batch plants. 3.5.1. Product Storage for Single Product Campaigns product during the campaign. For example, considering the products plant will produce 43 batches each of products A, B, and C in a 500 h Derin production rates for these three products are 10,000, 15,000, and 12.00 what is the amount of storage required? In practice, it is the volume an product that determines the required storage capacity. For this exam densities of each product are the same and equal to 1000 kg/m3. Coneia assuming that demand is steady, the demand rate (ra) is equal to 10,000 Note that the demand rate is calculated on the basis of plant operating 24-hour day. During the campaign, 10,000 kg of A must be made in 431 taking =2.5 h. Thus, during production, the production rate (r) (2.5) = 93.0 kg/h=0.0930 m3/h. Results for all the pr Table 3.1. Production and Demand Rates for Products A, B. product campaigns in a multiproduct plant, it is necessary to store e, considering the products produced in Example 3.3, the B. and C in a 500 h period. If the required 10.000, 15,000, and 12,000 kg/month, respectively, then it is the volume, and not the weight, of each city. For this example, it is assumed that the okam. Considering product A first and equal to 10,000/500 = 20 kg/h=0.020 m/h. at operating hours, and not on the basis of a e in 43 batch runs, with each run rate (r) of A is equal to 10,000/(43) given in Table 3.1. A, B, and C in Example 3.3 erating periods ing the Product Product B Product ated using Rate Volume (m) of prod Cycle time (h) m) of product required per month 10,0 2.5 (10)/I(43)(2.5)) = 0.0930 (10)/(500) - 0.020 pproximate cycle times based on Equation (3.5). Production rate, r, (m/h) Demand rate, , (m/h) These are approximate cycle tin 15.0 4.5 0.07752 0.030 12.0 4.5 0.06202 0.024 campaigns. BC is 19.5 5 - 24 produced When a campaign for a p When the campaign has sto Therefore, the accumulati shown in Figure 3.6. Th diagram The maximum using this single-product for a product is running, the rate of production is greater than the demand rate. on has stopped, the demand rate is greater than the production rate of zero. accumulation and depletion of product over the monthly period are similar to those 3.6. The changing inventory of material is represented on this figure by the bottom maximum inventory, V, is the minimum storage capacity that is required for the product indle-product campaign strategy. The expression for calculating V.is V = (r-ratam ach, but it give rise Demand Rates Volume of Product Production and s sses and Slope = 1,- Slope =- Campaign Time Nonproduction Time Zo store the y, then Total Time = 1 Month Figure 3.6. Changing Inventory of Product during Single Product Campaign Run within a Multiproduct Process le can is the campaign time. This assumes that the shipping rate of product from the plant is uring plant operating hours. Because shipping is usually itself a batch process, the actual formam.orage capacity could be more or less than that calculated in Equation (3.7). The strategies shipping schedules to minimize cost (including storage costs and missed-delivery risks) wn as logistics and are not covered here. n of the minimum storage capacities for all products in Example 3.3 is given in Example constant during plant ope minimum storage cap for matching shipping sch m/h. sofa are known as logisu Determination of the minimu -43) Example 3.7. For the products A, B, and Single-product campaig -B, and C in Example 3.3, determine the minimum storage capacities for the det campaign strategy outlined in Example 3.3. V. (m) Solution Table E3.7 shows the results using data given in Example 22 Storage Volume from Equation (3.7 Table E3.7. Results for the Estimation of Minimum Storage Volume from Equatio Product Campaign Time, t. (h) - (m/h) (43)(2.5) = 107.5 009302 -0.020 = 0.07302 (0.07302)(107.5) = 7.85 (43)(4.5) - 193.5 0.07752 -0.030 = 0.04752 (0.04752)(193.5) = 920 (43)(4.5) = 193.5 0.06202 -0.024 = 0.03802 (0.03802)(193.5) = 7.36 It should be noted that the production cycle time is equal to the sum of the campaign times, or (1075 + 193.5+ 193.5) = 494.5 h, which is slightly less than 500 h. This discrepancy reflects the approximation of cycle times given by Equation (3,6). The actual cycle times for A, B, and Care found from Example 3.3 and are equal to 2.63, 4.62, and 4.65 h, respectively. The corresponding values of V, are 7.79, 9.18, and 7.31 m. Clearly, these differences are small, and the approach using Equation (3.6) is acceptable when the number of production runs per campaign is 10 or more. 3.5.2. Intermediate Storage Up to this point, it has been assumed that there is no intermediate product storage available. This type of process is also known as a zero wait, or a zw process [4]. Specifically, as soon as a unit operation is completed, the products are transferred to the next unit operation in the sequence, or they go to final product storage. The concept of storing the final product to match the supply with the demand was demonstrated in Example 3.7. However, it may also be beneficial to store the output from a given piece of equipment for a period of time to increase the overall efficiency of a process. It may be possible to store product in the equipment that has just been used. For example, if two feed streams are mixed in a vessel, the mixture could be stored until the next process unit in the production sequence becomes available. In this case, the storage time is limited based on the scheduline of This holding-in-place method may not work for some unit operations. For example, in a reactor, a side reaction may take place, and unless the reaction can be anen v take place, and unless the reaction can be quenched, the product yield and selectivity will suffer. The upper limit of the intermediate storage ca will suffer. The upper limit of the intermediate storage concept occurs when there is unlimited intermediate storage (uis) available, and this is referred to available, and this is referred to as a uis process [4]. In d when intermediate product storage is available. This concept is formation given in Table 3.2 illustrated in Figure 3.7, which is based on the information given in Tab Reactor Crystallizer Dryer 0 Time 19 23 25 27 30 h Reactor Chystallizer Dryer Time 02 7 9 12 16 19 23 30 33 h 26 = 14 h Reactor Crystallizer Dryer Time 0 2 7 9 11 1922 27 30 33 h = 11 h Figure 3.7. Multiproduct Sequence (ABC) for Products Given in Table 3.2 Showing Effect of Intermediate Storage (Storage Shown as Circles; Number Identifies Individual Tanks for Each Intermediate Product) Table 3.2. Equipment Times (in Hours) Required for Products A, B, and C Product Reactor Crystallizer Dryer Total 2.0 5.0 2.0 9.0 6.0 4.0 4.0 14.0 2.0 2.0 7.0 Total Time per Equipment 10.0 11.0 ediate product storage, the shortest multiproduct campaign, as given by Equation (3.6), wn in Figure 3.7. However, if the materials leaving the reactor and crystallizer are prior to transfer to the crystallizer and dryer, respectively, then this time is reduced limiting cycle time for a uis process is given by 3.0 9.0 Without intermediate produ 14 h, as shown in Figure placed in storage prior to 11 h. The limiting cyc (3.8) = max nca fucks- 11 equence. For the case shown in Table 3.2 cause only one campaign for each product (A, B, and C) is used in the rem is the number of unit operations, N is the number of produ Faroduct i produced in a single multiproduct sequence. For the case shown campaigns of product i produced in a single m and Figure 3.7.= 1 (because only one campa ultiproduct sequence), and Equation (3.8) is the maximum or 11.0 h The total amount of storage required for this exam vessels are required, each dedicated to one interm storage required for this example is fairly small, because only three storage each dedicated to one intermediate product. The downside of this approach is many more material transfers required, and the potential for product contamination and operator error increases significantly. 3.5.3. Parallel Process Units Another strategy that can be employed to increase production is to use duplicate equipment. This strategy is most beneficial when there is a bottleneck involving a single piece of equipment that can be relieved by adding a second (or more) units in parallel. This strategy can be extended to a limiting case in which parallel trains of equipment are used for each product. This strategy eliminates the dependence of scheduling between the different products but is more expensive, because the number of pieces of equipment increases m-fold, where m is the number of products. An example of using parallel equipment is shown in Figure 3.8 based on the data in Table 3.3. Reactor Crystallizer Dryer Time 02 8 9 12 13 15 20 23 25 30 33 h ce = 21 h Reactor Crystallizer 1 Crystallizer 2 Dryer Time 0 2 4 8 9 121415 20 2 5 27 28 33 h = 13 h Figure 3.8. The Effect of Adding an Additional Crystallizer to the Process Given in To Table 3.2 Table 3.3. Data (Times in Hours) for Multiproduct Batch Process Shown in Figure 2


