

Question: There are two types of statistics we will study: Descriptive statistics: involves summarizing or describing data with charts, graphs, tables, and numeric calculations. Examples: average
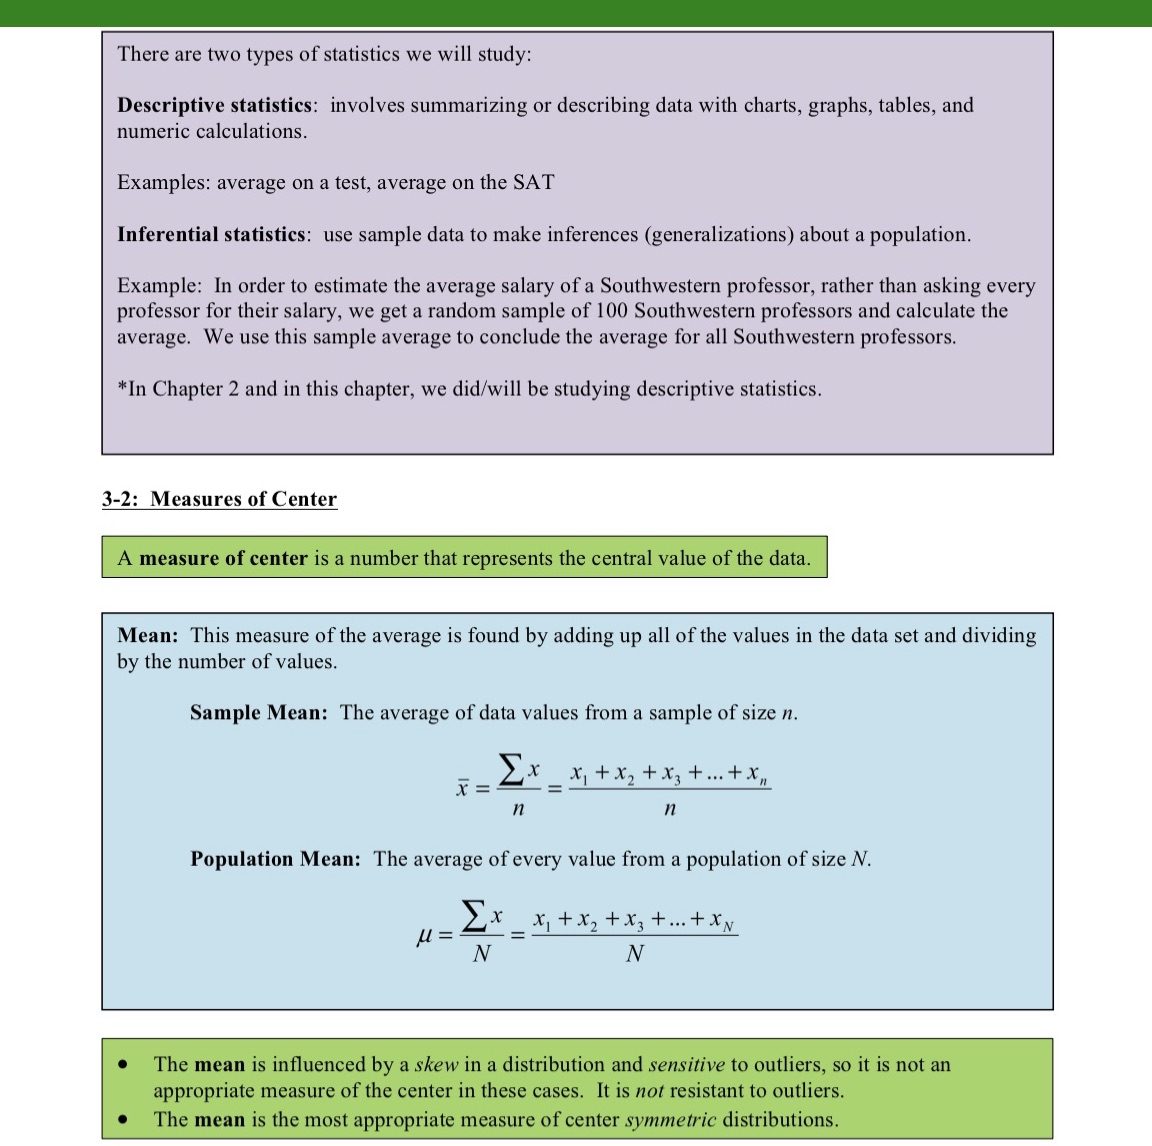
There are two types of statistics we will study: Descriptive statistics: involves summarizing or describing data with charts, graphs, tables, and numeric calculations. Examples: average on a test, average on the SAT Inferential statistics: use sample data to make inferences (generalizations) about a population. Example: In order to estimate the average salary of a Southwestern professor, rather than asking every professor for their salary, we get a random sample of 100 Southwestern professors and calculate the average. We use this sample average to conclude the average for all Southwestern professors. *In Chapter 2 and in this chapter, we did/will be studying descriptive statistics. 3-2: Measures of Center A measure of center is a number that represents the central value of the data. Mean: This measure of the average is found by adding up all of the values in the data set and dividing by the number of values. Sample Mean: The average of data values from a sample of size n. X = - [x x, txt x , + ...+x , n n Population Mean: The average of every value from a population of size N. U = Ex _x, + x 2 + x 3 + ...+ XN N N The mean is influenced by a skew in a distribution and sensitive to outliers, so it is not an appropriate measure of the center in these cases. It is not resistant to outliers. The mean is the most appropriate measure of center symmetric distributions
Step by Step Solution
There are 3 Steps involved in it

Get step-by-step solutions from verified subject matter experts