

Question: There are two worksheet tabs: Profroma tab has proforma data for income and balance sheet. Three color coded zones identify data, assumptions and conclusions. Historical
There are two worksheet tabs:
- Profroma tab has proforma data for income and balance sheet. Three color coded zones identify data, assumptions and conclusions. Historical data (Column B) is used to construct the proforma Columns C to H). You can change assumptions as needed.
- FCFF and FCFE tab provides a template to illustrate several alternative approaches to construct FCFF and FCFE. Use data from the Proforma tab to apply this template.
| Year 0 | 1 | 2 | 3 | 4 | 5 | 6 | Assumptions | ||||
| Sales Growth | 10% | 10% | 10% | 10% | 10% | 3% | Conclusions | ||||
| Payout Ratio | 40.0% | 40.0% | 40.0% | 40.0% | 40.0% | 40.0% | |||||
| Tax Rate | 40.0% | 40.0% | 40.0% | 40.0% | 40.0% | 34.0% | |||||
| Int. Rate | 10.0% | 10.0% | 10.0% | 10.0% | 10.0% | 10.0% | |||||
| Sales | 750.0 | 825.0 | 907.5 | 998.3 | 1098.1 | 1207.9 | 1244.1 | ||||
| CGS | 200.0 | 220.0 | 242.0 | 266.2 | 292.8 | 322.1 | 331.8 | 26.7% | % of Sales | ||
| SGA | 150.0 | 165.0 | 181.5 | 199.7 | 219.6 | 241.6 | 248.8 | 20.0% | % of Sales | ||
| Depreciation | 100.0 | 110.0 | 121.0 | 133.1 | 146.4 | 161.1 | 165.9 | 13.3% | % of Sales | ||
| EBIT | 300.0 | 330.0 | 363.0 | 399.3 | 439.2 | 483.2 | 497.6 | ||||
| Interest Expense | 25.0 | 7.2 | 7.9 | 8.7 | 9.5 | 10.5 | 10.8 | 10.0% | % of LT Debt | ||
| Profit bef. Taxes | 275.0 | 322.9 | 355.1 | 390.6 | 429.7 | 472.7 | 486.9 | ||||
| Taxes | 110.0 | 129.1 | 142.1 | 156.3 | 171.9 | 189.1 | 165.5 | ||||
| Net Income | 165.0 | 193.7 | 213.1 | 234.4 | 257.8 | 283.6 | 321.3 | ||||
| Dividend Payment | 77.5 | 85.2 | 93.8 | 103.1 | 113.4 | 128.5 | |||||
| Pro Forma Balance Sheet | |||||||||||
| Year 0 | 1 | 1 | 1 | 1 | 1 | 1 | |||||
| Cash | 90.0 | 99.0 | 108.9 | 119.8 | 131.8 | 144.9 | 149.3 | 12.0% | % of Sales | ||
| Mktbl Securities | 60.0 | 66.0 | 72.6 | 79.9 | 87.8 | 96.6 | 99.5 | 8.0% | % of Sales | ||
| A/R | 120.0 | 132.0 | 145.2 | 159.7 | 175.7 | 193.3 | 199.1 | 16.0% | % of Sales | ||
| Inventory | 100.0 | 110.0 | 121.0 | 133.1 | 146.4 | 161.1 | 165.9 | 13.3% | % of Sales | ||
| Fixed Assets(net) | 280.0 | 308.0 | 338.8 | 372.7 | 409.9 | 450.9 | 464.5 | 37.3% | % of Sales | net | |
| Total | 650.0 | 715.0 | 786.5 | 865.2 | 951.7 | 1046.8 | 1078.2 | ||||
| A/P | 84.0 | 92.4 | 101.6 | 111.8 | 123.0 | 135.3 | 139.3 | 11.2% | % of Sales | ||
| Oth Curr.Liabilities | 50.0 | 55.0 | 60.5 | 66.6 | 73.2 | 80.5 | 82.9 | 6.7% | % of Sales | ||
| LT Debt | 250.0 | 0.0 | 78.7 | 86.5 | 95.2 | 104.7 | 107.8 | 10% | % of Assets | ||
| Stockholder's Equity | 266.0 | 496.1 | 545.7 | 600.3 | 660.3 | 726.3 | 748.1 | ||||
| Total | 650.0 | 715.0 | 786.5 | 865.2 | 951.7 | 1046.8 | 1078.2 | ||||
| FCFF | 146.4 | 161.0 | 177.1 | 194.9 | 214.3 | 303.5 | |||||
| FCFE | -36.4 | 163.5 | 179.8 | 197.8 | 217.6 | 299.5 | |||||
| Addn to Retained Income | 165.0 | 116.2 | 127.8 | 140.6 | 154.7 | 170.2 | 192.8 | ||||
| New Equity Isuued | 0.0 | -78.2 | -86.1 | -94.7 | -104.1 | -171.0 | |||||
| LT Debt Issued | -178.5 | 7.2 | 7.9 | 8.7 | 9.5 | 3.1 | |||||
| New External Capital | -64.6 | -71.1 | -78.2 | -86.0 | -94.6 | -167.9 | |||||
CHECK MY WORK, IS THIS RIGHT?
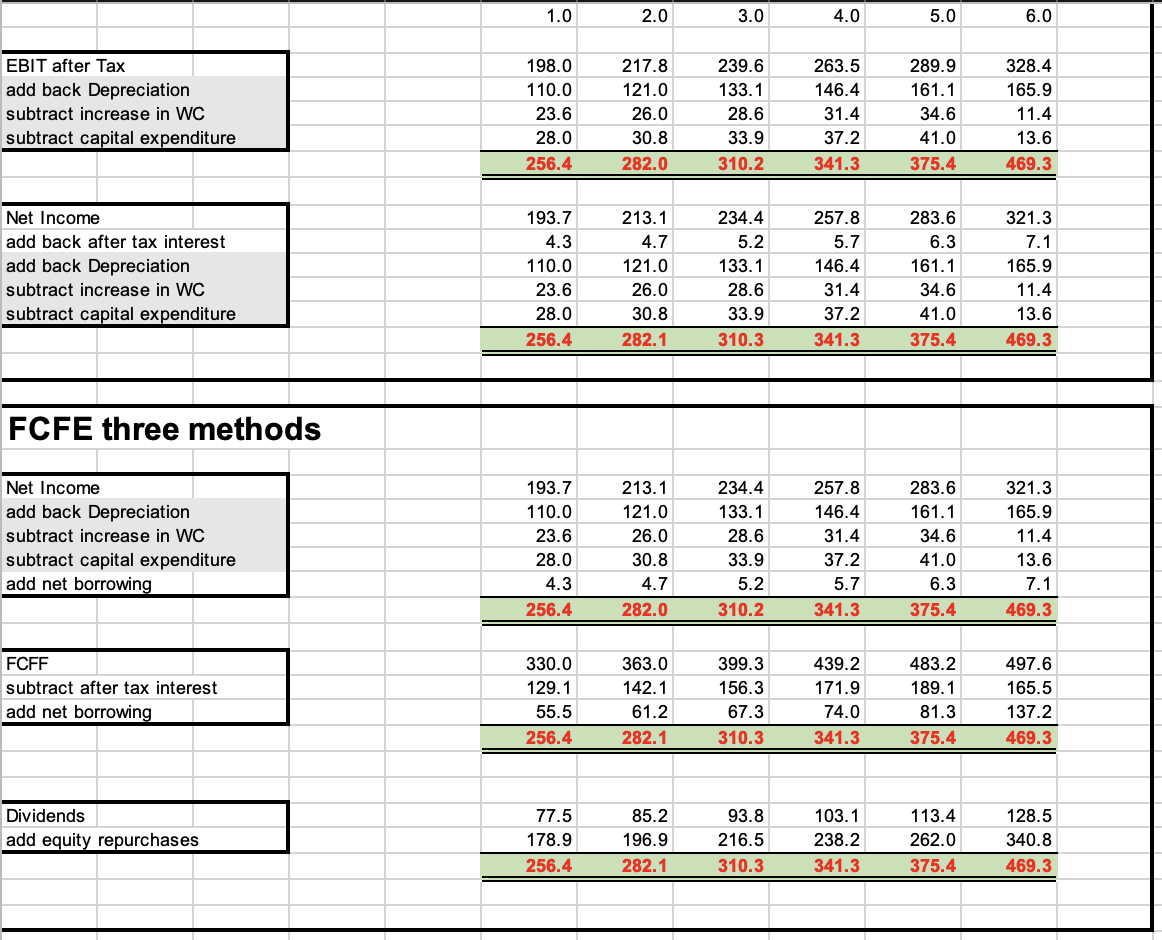
1.0 2.0 3.0 4.0 5.0 6.0 EBIT after Tax add back Depreciation subtract increase in WC subtract capital expenditure 198.0 110.0 23.6 28.0 256.4 217.8 121.0 26.0 30.8 282.0 239.6 133.1 28.6 33.9 310.2 263.5 146.4 31.4 37.2 341.3 289.9 161.1 34.6 41.0 375.4 328.4 165.9 11.4 13.6 469.3 Net Income add back after tax interest add back Depreciation subtract increase in WC subtract capital expenditure 213.1 4.7 121.0 193.7 4.3 110.0 23.6 28.0 256.4 234.4 5.2 133.1 28.6 33.9 310.3 257.8 5.7 146.4 31.4 37.2 341.3 283.6 6.3 161.1 34.6 41.0 375.4 321.3 7.1 165.9 11.4 13.6 469.3 26.0 30.8 282.1 FCFE three methods Net Income add back Depreciation subtract increase in WC subtract capital expenditure add net borrowing 193.7 110.0 23.6 28.0 4.3 256.4 213.1 121.0 26.0 30.8 4.7 282.0 234.4 133.1 28.6 33.9 5.2 310.2 257.8 146.4 31.4 37.2 5.7 341.3 283.6 161.1 34.6 41.0 6.3 375.4 321.3 165.9 11.4 13.6 7.1 469.3 FCFF subtract after tax interest add net borrowing 330.0 129.1 55.5 256.4 363.0 142.1 61.2 282.1 399.3 156.3 67.3 310.3 439.2 171.9 74.0 341.3 483.2 189.1 81.3 375.4 497.6 165.5 137.2 469.3 Dividends add equity repurchases 77.5 178.9 256.4 85.2 196.9 282.1 93.8 216.5 310.3 103.1 238.2 341.3 113.4 262.0 375.4 128.5 340.8 469.3 1.0 2.0 3.0 4.0 5.0 6.0 EBIT after Tax add back Depreciation subtract increase in WC subtract capital expenditure 198.0 110.0 23.6 28.0 256.4 217.8 121.0 26.0 30.8 282.0 239.6 133.1 28.6 33.9 310.2 263.5 146.4 31.4 37.2 341.3 289.9 161.1 34.6 41.0 375.4 328.4 165.9 11.4 13.6 469.3 Net Income add back after tax interest add back Depreciation subtract increase in WC subtract capital expenditure 213.1 4.7 121.0 193.7 4.3 110.0 23.6 28.0 256.4 234.4 5.2 133.1 28.6 33.9 310.3 257.8 5.7 146.4 31.4 37.2 341.3 283.6 6.3 161.1 34.6 41.0 375.4 321.3 7.1 165.9 11.4 13.6 469.3 26.0 30.8 282.1 FCFE three methods Net Income add back Depreciation subtract increase in WC subtract capital expenditure add net borrowing 193.7 110.0 23.6 28.0 4.3 256.4 213.1 121.0 26.0 30.8 4.7 282.0 234.4 133.1 28.6 33.9 5.2 310.2 257.8 146.4 31.4 37.2 5.7 341.3 283.6 161.1 34.6 41.0 6.3 375.4 321.3 165.9 11.4 13.6 7.1 469.3 FCFF subtract after tax interest add net borrowing 330.0 129.1 55.5 256.4 363.0 142.1 61.2 282.1 399.3 156.3 67.3 310.3 439.2 171.9 74.0 341.3 483.2 189.1 81.3 375.4 497.6 165.5 137.2 469.3 Dividends add equity repurchases 77.5 178.9 256.4 85.2 196.9 282.1 93.8 216.5 310.3 103.1 238.2 341.3 113.4 262.0 375.4 128.5 340.8 469.3
Step by Step Solution
There are 3 Steps involved in it

Get step-by-step solutions from verified subject matter experts