

Question: There is a problem solved on here already for this but it is not working in my program and I have no clue why. In
There is a problem solved on here already for this but it is not working in my program and I have no clue why.
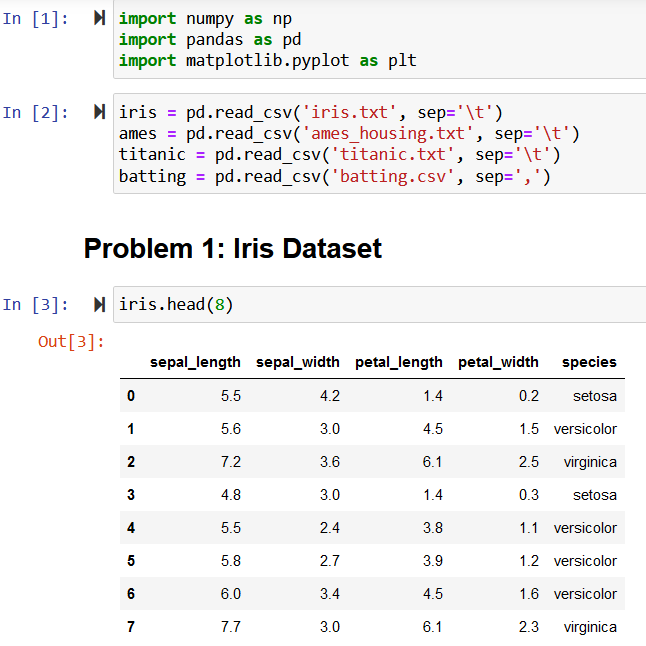
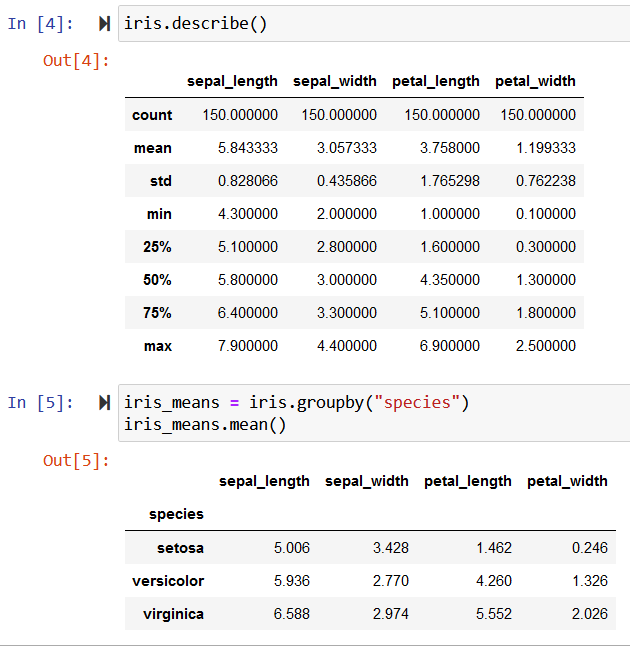
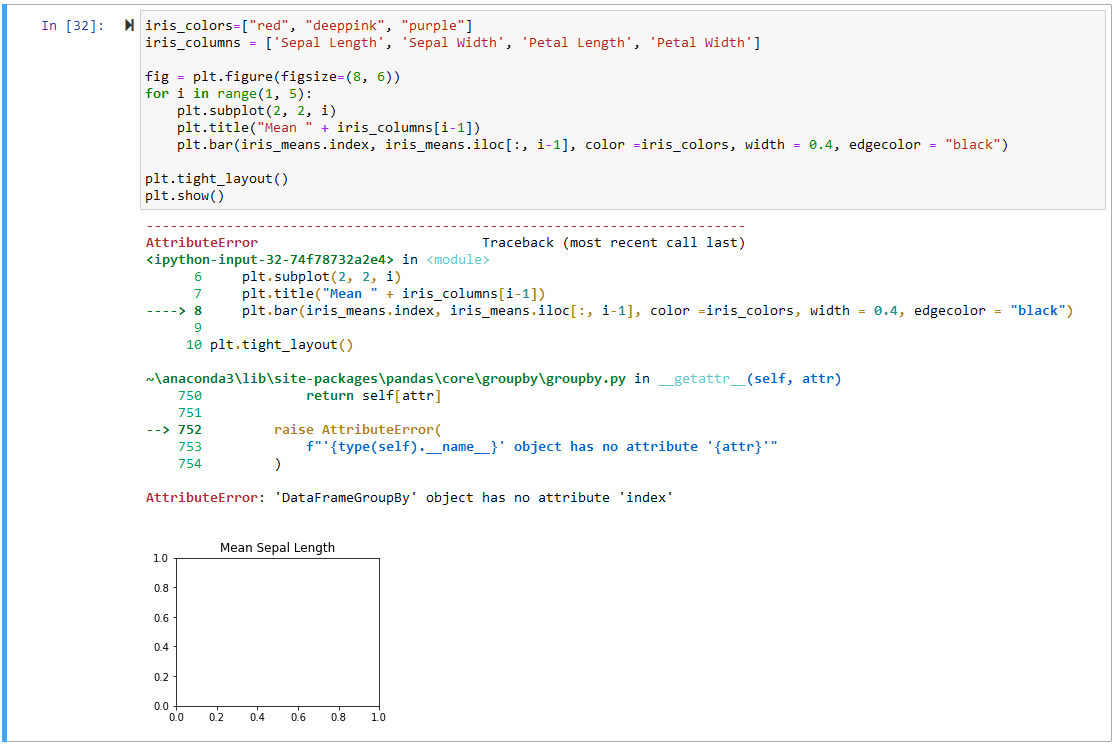
In this problem, we will use grouping operations to determine the average sepal length, sepal width, petal length, and pet width for each of the three iris species. Use the head() method to display the first 8 rows of the iris DataFrame. We will now display some descriptive statistics for each of the columns in the iris DataFrame. Use the describe( ) method to display information about the statistical distribution of each of the columns in iris. Next, we will apply grouping operations to calculate column means for each of the three species. Use groupby( ) and mean() to group the iris dataset by species, calculating the mean of each column for each of the three species. Store the results in a DataFrame named iris_means. Display the new DataFrame. Next, we use a bar chart to graphically represent the information calculated above. Create a list named iris_colors containing three named colors. Also create a list named iris_columns containing the following strings: 'Sepal Length', 'Sepal Width', 'Petal Length', 'Petal Width' Use a loop to create a figure containing four bar charts arranged in a 22 grid. - Set the figure size to [8,6]. - Each bar chart should contain three bars whose heights represent information from one of the four columns from the iris_means DataFrame. - The bars should be labeled according to the iris species they represent. You can extract this information from iris_means using iris_means.index. - The bars should have a black border. The color parameter should be set to the iris_colors list. - Each subplot should have one of the following titles: "Mean Sepal Length", "Mean Sepal Width", "Mean Petal Length", or "Mean Petal Width". You can use the iris_columns list to help form these titles. - Call plt.tight_layout( ) and display the figure using plt.plot(). [n[1]:importnumpyasnpimportpandasaspdimportmatplotlib.pyplotasplt Problem 1: Iris Dataset In [4]: M iris.describe() Out [4] : \begin{tabular}{rrrrr} & sepal_length & sepal_width & petal_length & petal_width \\ \hline count & 150.000000 & 150.000000 & 150.000000 & 150.000000 \\ mean & 5.843333 & 3.057333 & 3.758000 & 1.199333 \\ std & 0.828066 & 0.435866 & 1.765298 & 0.762238 \\ min & 4.300000 & 2.000000 & 1.000000 & 0.100000 \\ 25% & 5.100000 & 2.800000 & 1.600000 & 0.300000 \\ 50% & 5.800000 & 3.000000 & 4.350000 & 1.300000 \\ 75% & 6.400000 & 3.300000 & 5.100000 & 1.800000 \\ max & 7.900000 & 4.400000 & 6.900000 & 2.500000 \end{tabular} In [5]: iris_means = iris.groupby("species") iris_means.mean() Out [5] : sepal_length sepal_width petal_length petal_width \begin{tabular}{rrrrr} species & & & & \\ \hline setosa & 5.006 & 3.428 & 1.462 & 0.246 \\ versicolor & 5.936 & 2.770 & 4.260 & 1.326 \\ virginica & 6.588 & 2.974 & 5.552 & 2.026 \end{tabular}
Step by Step Solution
There are 3 Steps involved in it

Get step-by-step solutions from verified subject matter experts