

Question: there is a second part to this problem posted separately. please answer it as well A Financial Ratio Analysis of Target Corporation An Assessment of
there is a second part to this problem posted separately. please answer it as well
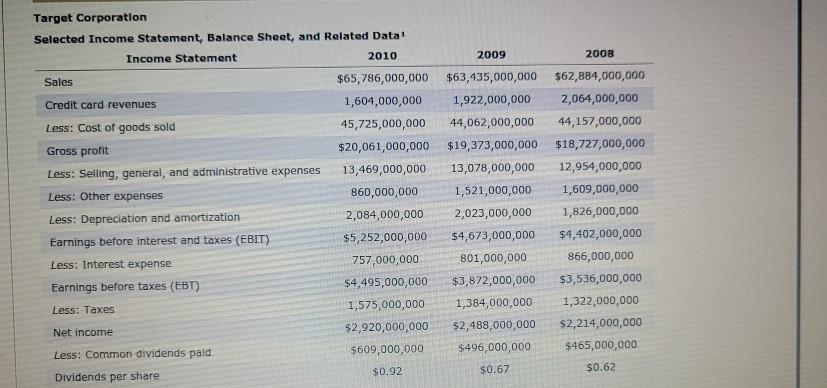
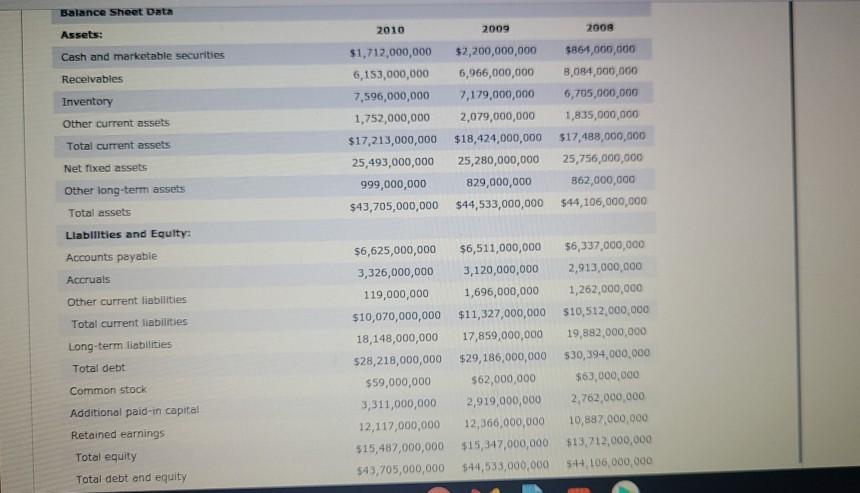
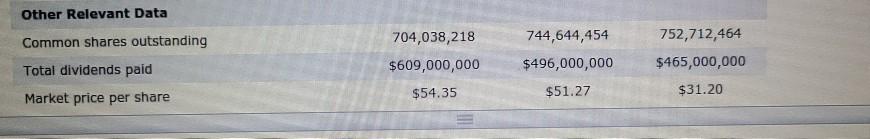
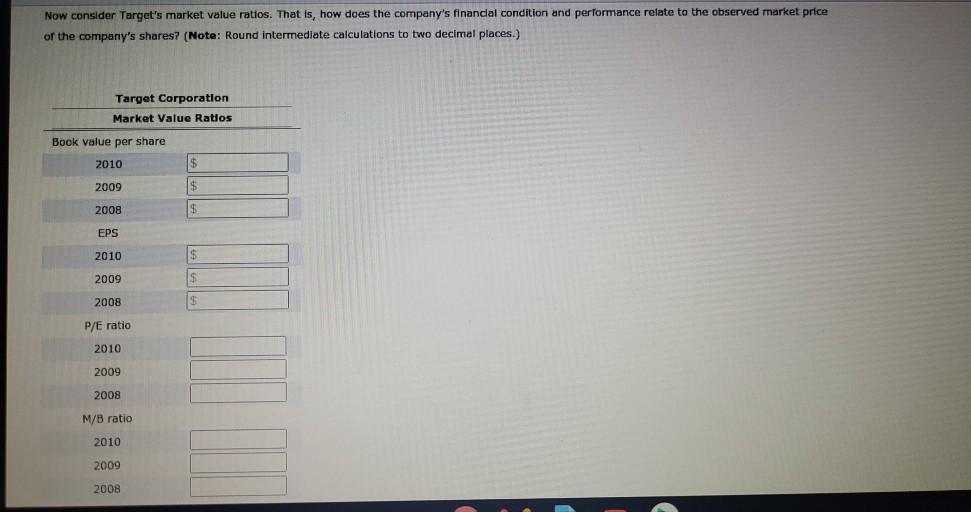
A Financial Ratio Analysis of Target Corporation An Assessment of Its Market Value Ratlos Assume that you are an existing shareholder of Target Corporation (TGT), a retailer of "everyday essentials and fashionable, differentiated merchandise at discounted prices, and are interested in the company's historical and current financial activities and performance. Use the following financial data for Targetto complete and conduct your financial ratio analysis. Then answer the questions that follow. Remember, the results of a ratio analysis often identify issues requiring additional investigation. 2009 2008 Target Corporation Selected Income Statement Balance Sheet, and Related Data! Income Statement 2010 Sales $65,786,000,000 Credit card revenues 1,604,000,000 Less: Cost of goods sold 45,725,000,000 Gross profit $20,061,000,000 Less: Selling, general, and administrative expenses 13,469,000,000 Less: Other expenses 860,000,000 Less: Depreciation and amortization 2,084,000,000 Earnings before interest and taxes (EBIT) $5,252,000,000 Less: Interest expense 757,000,000 Earnings before taxes (EBT) $4,495,000,000 Less: Taxes 1,575,000,000 Net income $2,920,000,000 Less: Common dividends paid $609,000,000 Dividends per share $0.92 $63,435,000,000 $62,884,000,000 1,922,000,000 2,064,000,000 44,062,000,000 44,157,000,000 $19,373,000,000 $18,727,000,000 13,078,000,000 12,954,000,000 1,521,000,000 1,609,000,000 2,023,000,000 1,826,000,000 $4,673,000,000 $4,402,000,000 801,000,000 866,000,000 $3,872,000,000 $3,536,000,000 1,384,000,000 1,322,000,000 $2,488,000,000 $2,214,000,000 $496,000,000 $465,000,000 $0.67 $0.62 Balance Sheet Data Assets: Cash and marketable securities Receivables Inventory Other current assets Total current assets Net fixed assets Other long-term assets Total assets Llabilities and Equity: Accounts payable Accruals 2010 2009 2008 $1,712,000,000 $2,200,000,000 $861,000,000 6,153,000,000 6,966,000,000 3,084,000,000 7,596,000,000 7,179,000,000 6,705,000,000 1,752,000,000 2,079,000,000 1,835,000,000 $17,213,000,000 $18,424,000,000 $17,488,000,000 25,493,000,000 25,280,000,000 25,756,000,000 999,000,000 829,000,000 862,000,000 $43,705,000,000 $44,533,000,000 $44,106,000,000 Other current liabilities Total current fiabilities Long-term liabilities Total debt $6,625,000,000 $6,511,000,000 56,337,000,000 3,326,000,000 3,120,000,000 2,913,000,000 119,000,000 1,696,000,000 1,262,000,000 $10,070,000,000 $11,327,000,000 $10,512,000,000 18,148,000,000 17,859,000,000 19,882,000,000 $28,218,000,000 $29,186,000,000 $30,394,000,000 $59,000,000 $62,000,000 $63,000,000 3,311,000,000 2,919,000,000 2,762,000,000 12,117,000,000 12,366,000,000 10,887,000,000 $15,487,000,000 $15,347,000,000 $13,712,000,000 $43, 705,000,000 $44,533,000,000 544 106,000,000 Common stock Additional paid-in capital Retained earnings Total equity Total debt and equity Other Relevant Data Common shares outstanding Total dividends paid Market price per share 704,038,218 $609,000,000 $54.35 744,644,454 $496,000,000 752,712,464 $465,000,000 $51.27 $31.20 Now consider Target's market value ratios. That is, how does the company's financial condition and performance relate to the observed market price of the company's shares? (Note: Round intermediate calculations to two decimal places.) Target Corporation Market Value Ratlos Book value per share 2010 $ $ 2009 2008 EPS 2010 $ $ 2009 2008 19 P/E ratio 2010 2009 2008 M/B ratio 2010 2009 2008
Step by Step Solution
There are 3 Steps involved in it

Get step-by-step solutions from verified subject matter experts