

Question: ** There is an error with the first image- the years at the top of the balance sheet are in the wrong order, it should
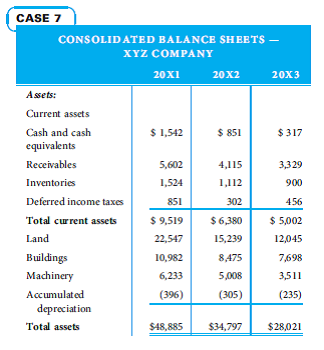
** There is an error with the first image- the years at the top of the balance sheet are in the wrong order, it should read as "20x3, 20x2, 20x1 at the top. The dollar values are all in the correct place.
Calculate ratios for all three years and compare them to determine if XYZ is possibly underreporting accounts payable. If you detect possible fraud, explain why you think it might exist.
Required ratio calculations:
| Acid-test ratio (Quick assets/Current liabilities) |
| Current ratio (Current assets/Current liabilities) |
| Accounts payable/Cost of goods sold |
| Accounts payable/Total liabilities |
| Accounts payable/Inventory |
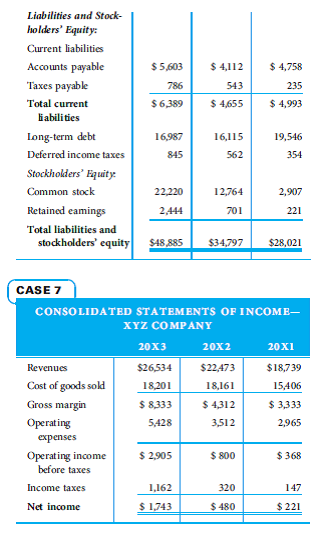
| CASE 7 CONSOLIDATED BALANCE SHEETS - XYZ COMPANY 20x120x2 20x3 Assets: Current assets $ 1,542 $ 851 $317 Cash and cash equivalents Receivables Inventories Deferred income taxes Total current assets Land 5.602 1,524 851 4,115 1,112 302 $6,380 15,239 8,475 5,008 (305) $ 9,519 22,547 10,982 6,233 (396) 3,329 900 456 $5,002 12,045 7,698 3,511 (235) Buildings Machinery Accumulated depreciation Total assets $48.885 $34,797 $28,021 $ 5,603 786 $ 4,112 543 $ 4,655 $ 4,758 235 $ 4,993 $ 6,389 Liabilities and Stock- holders' Equity Current liabilities Accounts payable Taxes payable Total current liabilities Long-term debt Deferred income taxes Stockholders' Equity Common stock Retained eamings Total liabilities and stockholders' equity 19,546 16,987 845 16,115 562 354 22,220 12,764 2,907 2.444 201 $48 885 $34,797 $28,021 CASE 7 CONSOLIDATED STATEMENTS OF INCOME- XYZ COMPANY 20x3 20x2 20x1 $26,534 18,201 $22.473 18,161 Revenues Cost of goods sold Gross margin Operating expenses $18,739 15,406 $ 3,333 2,965 $ 8,333 5,428 $ 4,312 3,512 $ 2,905 $ 800 $368 Operating income before taxes Income taxes 320 147 1.162 $ 1743 Net income $ 480 $ 221
Step by Step Solution
There are 3 Steps involved in it

Get step-by-step solutions from verified subject matter experts