

Question: There is more date ranges, it is actually up to 505. Comment if you need more to see to be able to solve it or
There is more date ranges, it is actually up to 505. Comment if you need more to see to be able to solve it or if you can at least explain how to get the answer instead of the actual answer.
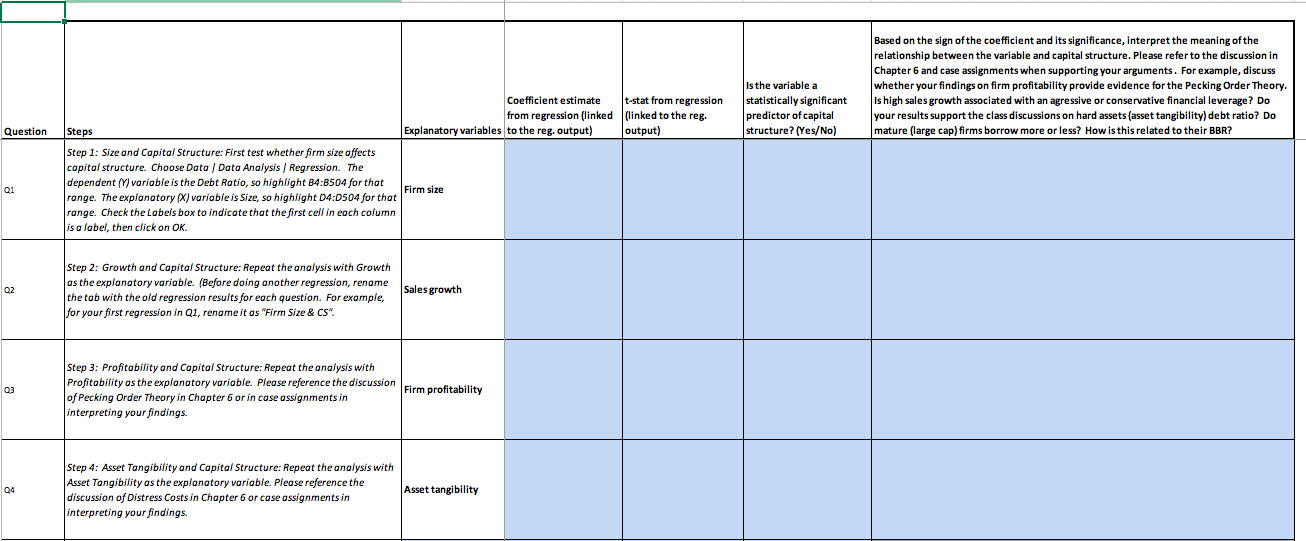
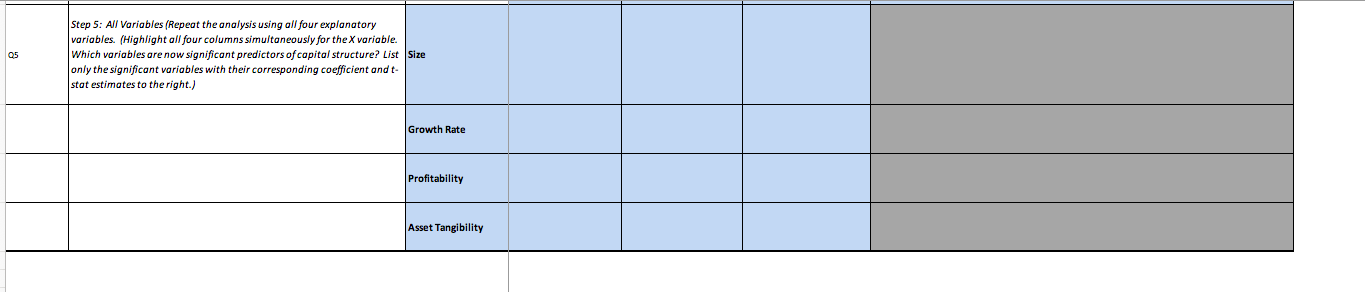
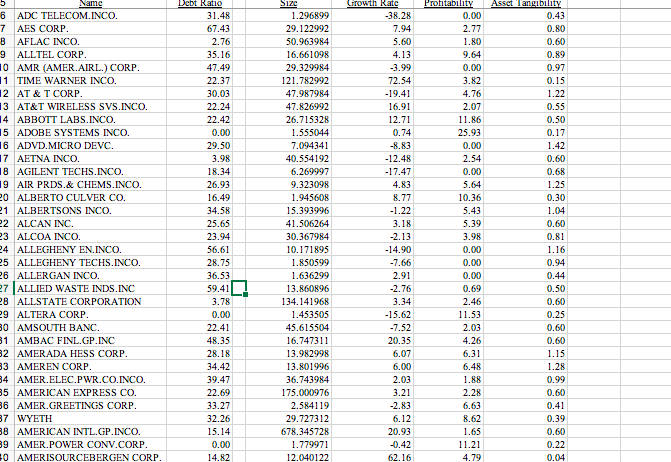
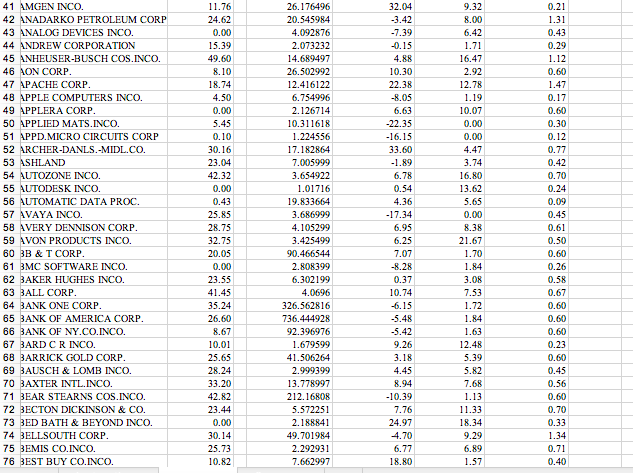
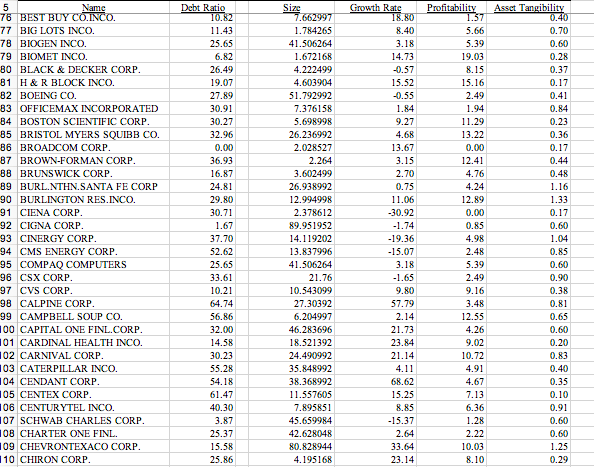
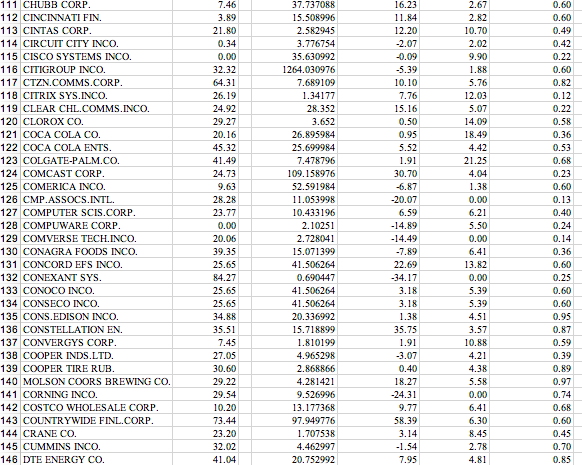
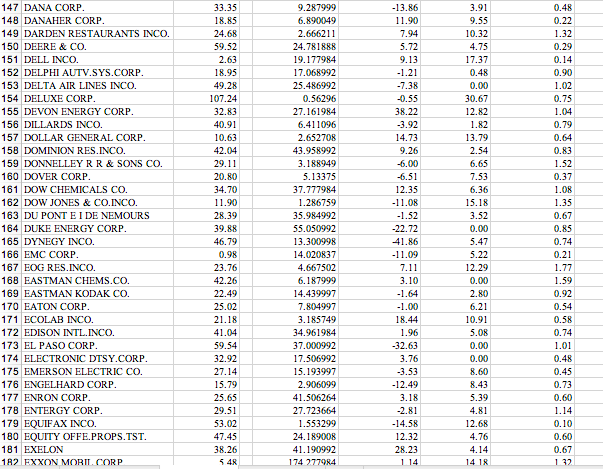
Is the variable a statistically significant predictor of capital structure? (Yes/No) Based on the sign of the coefficient and its significance, interpret the meaning of the relationship between the variable and capital structure. Please refer to the discussion in Chapter 6 and case assignments when supporting your arguments. For example, discuss whether your findings on firm profitability provide evidence for the Pecking Order Theory. Is high sales growth associated with an agressive or conservative financial leverage? Do your results support the class discussions on hard assets (asset tangibility) debt ratio? Do mature (large cap)firms borrow more or less? How is this related to their BBR? Question Coefficient estimate t-stat from regression from regression (linked (linked to the reg. Steps Explanatory variables to the reg. output) output) Step 1: Size and Capital Structure: First test whether firm size affects capital structure. Choose Data / Data Analysis / Regression. The dependent (Y) variable is the Debt Rotio, so highlight B4:B504 for that Firm size range. The explanatory (x) variable is size, so highlight 04:0504 for that range. Check the Labels box to indicate that the first cell in each column is a label, then click on OK. 01 02 Step 2: Growth and Capital Structure: Repeat the analysis with Growth as the explanatory variable. (Before doing another regression, rename the tab with the old regression results for each question. For example, for your first regression in Q1, rename it as "Firm Size & CS". Sales growth 03 Step 3: Profitability and Capital Structure: Repeat the analysis with Profitability as the explanatory variable. Please reference the discussion Firm profitability of Pecking Order Theory in Chapter 6 or in case assignments in interpreting your findings. 04 Step 4: Asset Tangibility and Capital Structure: Repeat the analysis with Asset Tangibility as the explanatory variable. Please reference the discussion of Distress Costs in Chapter 6 or case assignments in interpreting your findings. Asset tangibility 05 Step 5: All Variables (Repeat the analysis using all four explanatory variables. (Highlight all four columns simultaneously for the X variable. Which variables are now significant predictors of capital structure? List Size only the significant variables with their corresponding coefficient and t- stat estimates to the right.) Growth Rate Profitability Asset Tangibility 5 Name 6 ADC TELECOM. INCO. 7 AES CORP. 8 AFLAC INCO. 9 ALLTEL CORP. 10 AMR (AMER.AIRL.) CORP. 11 TIME WARNER INCO. 2 AT & T CORP. 13 AT&T WIRELESS SVS.INCO. 14 ABBOTT LABS.INCO. 15 ADOBE SYSTEMS INCO. 16 ADVD.MICRO DEVC. 17 AETNA INCO. 18 AGILENT TECHS.INCO. 19 AIR PRDS.& CHEMS.INCO. 20 ALBERTO CULVER CO. 21 ALBERTSONS INCO. 22 ALCAN INC. 23 ALCOA INCO. 24 ALLEGHENY EN.INCO. 25 ALLEGHENY TECHS.INCO. 26 ALLERGAN INCO. 27 ALLIED WASTE INDS.INC 28 ALLSTATE CORPORATION 29 ALTERA CORP. 30 AMSOUTH BANC. 31 AMBAC FINL.GP.INC 32 AMERADA HESS CORP. 33 AMEREN CORP. 34 AMER.ELEC.PWR.CO.INCO. 35 AMERICAN EXPRESS CO. 36 AMER.GREETINGS CORP. 37 WYETH 38 AMERICAN INTL.GP.INCO. 89 AMER.POWER CONV.CORP. 0 AMERISOURCEBERGEN CORP. Dcht Ratio 31.48 67.43 2.76 35.16 47.49 22.37 30.03 22.24 22.42 0.00 29.50 3.98 18.34 26.93 16.49 34.58 25.65 23.94 56.61 28.75 36.53 59.41 3.78 0.00 22.41 48.35 28.18 34.42 39.47 22.69 33.27 32.26 15.14 0.00 14.82 Size 1.296899 29.122992 50.963984 16.661098 29.329984 121.782992 47.987984 47.826992 26.715328 1.555044 7.094341 40.554192 6.269997 9.323098 1.945608 15.393996 41.506264 30.367984 10.171895 1.850599 1.636299 13.860896 134.141968 1.453505 45.615504 16.747311 13.982998 13.801996 36.743984 175.000976 2.584119 29.727312 678.345728 1.779971 12.040122 Growth Kate -38.28 7.94 5.60 4.13 -3.99 72.54 -19.41 16.91 12.71 0.74 -8.83 -12.48 -17.47 4.83 8.77 -1.22 3.18 -2.13 -14.90 -7.66 2.91 -2.76 3.34 -15.62 -7.52 20.35 6.07 6.00 2.03 3.21 -2.83 Profitability 0.00 2.77 1.80 9.64 0.00 3.82 4.76 2.07 11.86 25.93 0.00 2.54 0.00 5.64 10.36 5.43 5.39 3.98 0.00 0.00 0.00 0.69 2.46 11.53 2.03 4.26 6.31 6.48 1.88 2.28 6.63 8.62 1.65 11.21 4.79 Asset Tangibimy 0.43 0.80 0.60 0.89 0.97 0.15 1.22 0.55 0.50 0.17 1.42 0.60 0.68 1.25 0.30 1.04 0.60 0.81 1.16 0.94 0.44 0.50 0.60 0.25 0.60 0.60 1.15 1.28 0.99 0.60 0.41 0.39 0.60 0.22 0.04 6.12 20.93 -0.42 62.16 11.76 24.62 0.00 15.39 49.60 8.10 18.74 4.50 0.00 5.45 0.10 30.16 23.04 42.32 0.00 0.43 25.85 28.75 32.75 20.05 32.04 -3.42 -7.39 -0.15 4.88 10.30 22.38 -8.05 6.63 -22.35 -16.15 33.60 -1.89 6.78 41 AMGEN INCO. 42 ANADARKO PETROLEUM CORP 43 ANALOG DEVICES INCO. 44 ANDREW CORPORATION 45 ANHEUSER-BUSCH COS.INCO. 46 AON CORP. 47 APACHE CORP. 48 APPLE COMPUTERS INCO. 49 APPLERA CORP. 50 APPLIED MATS.INCO. 51 APPD.MICRO CIRCUITS CORP 52 ARCHER-DANLS.-MIDL.CO. 53 ASHLAND 54 AUTOZONE INCO. 55 AUTODESK INCO. 56 AUTOMATIC DATA PROC. 57 AVAYA INCO. 58 AVERY DENNISON CORP. 59 AVON PRODUCTS INCO. 60 BB & T CORP. 61 BMC SOFTWARE INCO. 62 BAKER HUGHES INCO. 63 BALL CORP. 64 BANK ONE CORP. 65 BANK OF AMERICA CORP. 66 BANK OF NY.CO.INCO. 67 BARD CR INCO. 68 BARRICK GOLD CORP. 69 BAUSCH & LOMB INCO. 70 BAXTER INTL.INCO. 71 BEAR STEARNS COS.INCO. 72 3ECTON DICKINSON & CO. 73 BED BATH & BEYOND INCO. 74 BELLSOUTH CORP. 75 BEMIS CO.INCO. 76 BEST BUY CO.INCO. 0.54 26.176496 20.545984 4.092876 2.073232 14.689497 26.502992 12.416122 6.754996 2.126714 10.311618 1.224556 17.182864 7.005999 3.654922 1.01716 19.833664 3.686999 4.105299 3.425499 90.466544 2.808399 6.302199 4.0696 326.562816 736.444928 92.396976 1.679599 41.506264 2.999399 13.778997 212.16808 5.572251 2.188841 49.701984 2.292931 7.662997 9.32 8.00 6.42 1.71 16.47 2.92 12.78 1.19 10.07 0.00 0.00 4.47 3.74 16.80 13.62 5.65 0.00 8.38 21.67 1.70 1.84 3.08 7.53 1.72 1.84 1.63 12.48 5.39 5.82 7.68 1.13 11.33 18.34 9.29 6.89 1.57 0.21 1.31 0.43 0.29 1.12 0.60 1.47 0.17 0.60 0.30 0.12 0.77 0.42 0.70 0.24 0.09 0.45 0.61 0.50 0.60 0.26 0.58 0.67 0.60 0.60 0.60 0.23 0.60 0.45 0.56 0.60 0.70 0.33 1.34 0.71 0.40 4.36 -17.34 6.95 6.25 7.07 -8.28 0.37 10.74 -6.15 -5.48 -5.42 9.26 3.18 4.45 8.94 -10.39 7.76 24.97 4.70 0.00 23.55 41.45 35.24 26.60 8.67 10.01 25.65 28.24 33.20 42.82 23.44 0.00 30.14 25.73 10.82 6.77 18.80 5 Name 76 BEST BUY CO.INCO. 77 BIG LOTS INCO. 78 BIOGEN INCO. 79 BIOMET INCO. BO BLACK & DECKER CORP. B1 H&R BLOCK INCO. 82 BOEING CO. 83 OFFICEMAX INCORPORATED 84 BOSTON SCIENTIFIC CORP. 85 BRISTOL MYERS SQUIBB CO. B6 BROADCOM CORP. 87 BROWN-FORMAN CORP. 88 BRUNSWICK CORP. 89 BURL.NTHN.SANTA FE CORP 90 BURLINGTON RES.INCO. 91 CIENA CORP. 92 CIGNA CORP. 93 CINERGY CORP. 94 CMS ENERGY CORP. 95 COMPAQ COMPUTERS 96 CSX CORP. 97 CVS CORP. 98 CALPINE CORP. 99 CAMPBELL SOUP CO. 100 CAPITAL ONE FINL.CORP. 101 CARDINAL HEALTH INCO. 102 CARNIVAL CORP. 103 CATERPILLAR INCO. 104 CENDANT CORP. 105 CENTEX CORP. 106 CENTURYTEL INCO. 107 SCHWAB CHARLES CORP. 108 CHARTER ONE FINL. 109 CHEVRONTEXACO CORP. 10 CHIRON CORP. Debt Ratio 10.82 11.43 25.65 6.82 26.49 19.07 27.89 30.91 30.27 32.96 0.00 36.93 16.87 24.81 29.80 30.71 1.67 37.70 52.62 25.65 33.61 10.21 64.74 56.86 32.00 14.58 30.23 55.28 54.18 61.47 40.30 3.87 25.37 15.58 25.86 Size 7.662997 1.784265 41.506264 1.672168 4.222499 4.603904 51.792992 7.376158 5.698998 26.236992 2.028527 2.264 3.602499 26.938992 12.994998 2.378612 89.951952 14.119202 13.837996 41.506264 21.76 10.543099 27.30392 6.204997 46.283696 18.521392 24.490992 35.848992 38.368992 11.557605 7.895851 45.659984 42.628048 80.828944 4.195168 Growth Rate 18.80 8.40 3.18 14.73 -0.97 15.52 -0.95 1.84 9.27 4.68 13.67 3.15 2.70 0.75 11.06 -30.92 -1.74 -19.36 -15.07 3.18 -1.65 9.80 57.79 2.14 21.73 23.84 21.14 4.11 68.62 15.25 8.85 -15.37 2.64 33.64 23.14 Profitability 1.57 5.66 5.39 19.03 8.15 15.16 2.49 1.94 11.29 13.22 0.00 12.41 4.76 4.24 12.89 0.00 0.85 4.98 2.48 5.39 2.49 9.16 3.48 12.55 4.26 9.02 10.72 4.91 4.67 7.13 6.36 1.28 2.22 10.03 8.10 Asset Tangibility 0.40 0.70 0.60 0.28 0.37 0.17 0.41 0.84 0.23 0.36 0.17 0.44 0.48 1.16 1.33 0.17 0.60 1.04 0.85 0.60 0.90 0.38 0.81 0.65 0.60 0.20 0.83 0.40 0.35 0.10 0.91 0.60 0.60 1.25 0.29 16.23 11.84 12.20 -2.07 -0.09 -5.39 10.10 7.76 15.16 0.50 0.95 5.52 1.91 30.70 -6.87 -20.07 0.60 0.60 0.49 0.42 0.22 0.60 0.82 0.12 0.22 0.58 0.36 0.53 0.68 0.23 0.60 0.13 6.59 0.40 111 CHUBB CORP 112 CINCINNATI FIN. 113 CINTAS CORP. 114 CIRCUIT CITY INCO. 115 CISCO SYSTEMS INCO. 116 CITIGROUP INCO. 117 CTZN.COMMS.CORP. 118 CITRIX SYS.INCO. 119 CLEAR CHL.COMMS.INCO. 120 CLOROX CO. 121 COCA COLA CO. 122 COCA COLA ENTS. 123 COLGATE-PALM.CO. 124 COMCAST CORP. 125 COMERICA INCO. 126 CMP.ASSOCS.INTL. 127 COMPUTER SCIS.CORP. 128 COMPUWARE CORP. 129 COMVERSE TECH.INCO. 130 CONAGRA FOODS INCO. 131 CONCORD EFS INCO. 132 CONEXANT SYS. 133 CONOCO INCO. 134 CONSECO INCO. 135 CONS.EDISON INCO. 136 CONSTELLATION EN. 137 CONVERGYS CORP. 138 COOPER INDS.LTD. 139 COOPER TIRE RUB. 140 MOLSON COORS BREWING CO. 141 CORNING INCO. 142 COSTCO WHOLESALE CORP. 143 COUNTRYWIDE FINL.CORP. 144 CRANE CO. 145 CUMMINS INCO. 146 DTE ENERGY CO. 7.46 3.89 21.80 0.34 0.00 32.32 64.31 26.19 24.92 29.27 20.16 45.32 41.49 24.73 9.63 28.28 23.77 0.00 20.06 39.35 25.65 84.27 25.65 25.65 34.88 35.51 7.45 27.05 30.60 29.22 29.54 10.20 73.44 23.20 32.02 41.04 37.737088 15.508996 2.582945 3.776754 35.630992 1264.030976 7.689109 1.34177 28.352 3.652 26.895984 25.699984 7.478796 109.158976 52.591984 11.053998 10.433196 2.10251 2.728041 15.071399 41.506264 0.690447 41.506264 41.506264 20.336992 15.718899 1.810199 4.965298 2.868866 4.281421 9.526996 13.177368 97.949776 1.707538 4.462997 20.752992 -14.89 -14.49 -7.89 22.69 -34.17 3.18 3.18 1.38 35.75 1.91 -3.07 0.40 18.27 -24.31 9.77 58.39 3.14 -1.54 7.95 2.67 2.82 10.70 2.02 9.90 1.88 5.76 12.03 5.07 14.09 18.49 4.42 21.25 4.04 1.38 0.00 6.21 5.50 0.00 6.41 13.82 0.00 5.39 5.39 4.51 3.57 10.88 4.21 4.38 5.58 0.00 6.41 6.30 8.45 2.78 4.81 0.24 0.14 0.36 0.60 0.25 0.60 0.60 0.95 0.87 0.59 0.39 0.89 0.97 0.74 0.68 0.60 0.45 0.70 0.85 147 DANA CORP. 148 DANAHER CORP. 149 DARDEN RESTAURANTS INCO. 150 DEERE & CO. 151 DELL INCO. 152 DELPHI AUTV.SYS.CORP. 153 DELTA AIR LINES INCO. 154 DELUXE CORP. 155 DEVON ENERGY CORP. 156 DILLARDS INCO. 157 DOLLAR GENERAL CORP. 158 DOMINION RES.INCO. 159 DONNELLEY R R & SONS CO. 160 DOVER CORP. 161 DOW CHEMICALS CO. 162 DOW JONES & CO.INCO. 163 DU PONT E I DE NEMOURS 164 DUKE ENERGY CORP. 165 DYNEGY INCO. 166 EMC CORP. 167 EOG RES.INCO. 168 EASTMAN CHEMS.CO. 169 EASTMAN KODAK CO. 170 EATON CORP 171 ECOLAB INCO. 172 EDISON INTL.INCO. 173 EL PASO CORP. 174 ELECTRONIC DTSY.CORP. 175 EMERSON ELECTRIC CO. 176 ENGELHARD CORP. 177 ENRON CORP. 178 ENTERGY CORP. 179 EQUIFAX INCO. 180 EQUITY OFFE.PROPS.TST. 181 EXELON 182 EXXON MOBIL CORP 33.35 18.85 24.68 59.52 2.63 18.95 49.28 107.24 32.83 40.91 10.63 42.04 29.11 20.80 34.70 11.90 28.39 39.88 46.79 0.98 23.76 42.26 22.49 25.02 21.18 41.04 59.54 32.92 27.14 15.79 25.65 29.51 53.02 47.45 38.26 548 9.287999 6.890049 2.666211 24.781888 19.177984 17.068992 25.486992 0.56296 27.161984 6.411096 2.652708 43.958992 3.188949 5.13375 37.777984 1.286759 35.984992 55.050992 13.300998 14.020837 4.667502 6.187999 14.439997 7.804997 3.185749 34.961984 37.000992 17.506992 15.193997 2.906099 41.506264 27.723664 1.553299 24.189008 41.190992 174 277984 -13.86 11.90 7.94 5.72 9.13 -1.21 -7.38 -0.55 38.22 -3.92 14.73 9.26 -6.00 -6.51 12.35 -11.08 -1.92 -22.72 41.86 -11.09 7.11 3.10 -1.64 -1.00 18.44 1.96 -32.63 3.76 -3.53 -12.49 3.18 -2.81 -14.58 12.32 28.23 3.91 9.55 10.32 4.75 17.37 0.48 0.00 30.67 12.82 1.82 13.79 2.54 6.65 7.53 6.36 15.18 3.52 0.00 5.47 5.22 12.29 0.00 2.80 6.21 10.91 5.08 0.00 0.00 8.60 8.43 5.39 4.81 12.68 4.76 4.14 14 18 0.48 0.22 1.32 0.29 0.14 0.90 1.02 0.75 1.04 0.79 0.64 0.83 1.52 0.37 1.08 1.35 0.67 0.85 0.74 0.21 1.77 1.59 0.92 0.54 0.58 0.74 1.01 0.48 0.45 0.73 0.60 1.14 0.10 0.60 0.67 1.32 Is the variable a statistically significant predictor of capital structure? (Yes/No) Based on the sign of the coefficient and its significance, interpret the meaning of the relationship between the variable and capital structure. Please refer to the discussion in Chapter 6 and case assignments when supporting your arguments. For example, discuss whether your findings on firm profitability provide evidence for the Pecking Order Theory. Is high sales growth associated with an agressive or conservative financial leverage? Do your results support the class discussions on hard assets (asset tangibility) debt ratio? Do mature (large cap)firms borrow more or less? How is this related to their BBR? Question Coefficient estimate t-stat from regression from regression (linked (linked to the reg. Steps Explanatory variables to the reg. output) output) Step 1: Size and Capital Structure: First test whether firm size affects capital structure. Choose Data / Data Analysis / Regression. The dependent (Y) variable is the Debt Rotio, so highlight B4:B504 for that Firm size range. The explanatory (x) variable is size, so highlight 04:0504 for that range. Check the Labels box to indicate that the first cell in each column is a label, then click on OK. 01 02 Step 2: Growth and Capital Structure: Repeat the analysis with Growth as the explanatory variable. (Before doing another regression, rename the tab with the old regression results for each question. For example, for your first regression in Q1, rename it as "Firm Size & CS". Sales growth 03 Step 3: Profitability and Capital Structure: Repeat the analysis with Profitability as the explanatory variable. Please reference the discussion Firm profitability of Pecking Order Theory in Chapter 6 or in case assignments in interpreting your findings. 04 Step 4: Asset Tangibility and Capital Structure: Repeat the analysis with Asset Tangibility as the explanatory variable. Please reference the discussion of Distress Costs in Chapter 6 or case assignments in interpreting your findings. Asset tangibility 05 Step 5: All Variables (Repeat the analysis using all four explanatory variables. (Highlight all four columns simultaneously for the X variable. Which variables are now significant predictors of capital structure? List Size only the significant variables with their corresponding coefficient and t- stat estimates to the right.) Growth Rate Profitability Asset Tangibility 5 Name 6 ADC TELECOM. INCO. 7 AES CORP. 8 AFLAC INCO. 9 ALLTEL CORP. 10 AMR (AMER.AIRL.) CORP. 11 TIME WARNER INCO. 2 AT & T CORP. 13 AT&T WIRELESS SVS.INCO. 14 ABBOTT LABS.INCO. 15 ADOBE SYSTEMS INCO. 16 ADVD.MICRO DEVC. 17 AETNA INCO. 18 AGILENT TECHS.INCO. 19 AIR PRDS.& CHEMS.INCO. 20 ALBERTO CULVER CO. 21 ALBERTSONS INCO. 22 ALCAN INC. 23 ALCOA INCO. 24 ALLEGHENY EN.INCO. 25 ALLEGHENY TECHS.INCO. 26 ALLERGAN INCO. 27 ALLIED WASTE INDS.INC 28 ALLSTATE CORPORATION 29 ALTERA CORP. 30 AMSOUTH BANC. 31 AMBAC FINL.GP.INC 32 AMERADA HESS CORP. 33 AMEREN CORP. 34 AMER.ELEC.PWR.CO.INCO. 35 AMERICAN EXPRESS CO. 36 AMER.GREETINGS CORP. 37 WYETH 38 AMERICAN INTL.GP.INCO. 89 AMER.POWER CONV.CORP. 0 AMERISOURCEBERGEN CORP. Dcht Ratio 31.48 67.43 2.76 35.16 47.49 22.37 30.03 22.24 22.42 0.00 29.50 3.98 18.34 26.93 16.49 34.58 25.65 23.94 56.61 28.75 36.53 59.41 3.78 0.00 22.41 48.35 28.18 34.42 39.47 22.69 33.27 32.26 15.14 0.00 14.82 Size 1.296899 29.122992 50.963984 16.661098 29.329984 121.782992 47.987984 47.826992 26.715328 1.555044 7.094341 40.554192 6.269997 9.323098 1.945608 15.393996 41.506264 30.367984 10.171895 1.850599 1.636299 13.860896 134.141968 1.453505 45.615504 16.747311 13.982998 13.801996 36.743984 175.000976 2.584119 29.727312 678.345728 1.779971 12.040122 Growth Kate -38.28 7.94 5.60 4.13 -3.99 72.54 -19.41 16.91 12.71 0.74 -8.83 -12.48 -17.47 4.83 8.77 -1.22 3.18 -2.13 -14.90 -7.66 2.91 -2.76 3.34 -15.62 -7.52 20.35 6.07 6.00 2.03 3.21 -2.83 Profitability 0.00 2.77 1.80 9.64 0.00 3.82 4.76 2.07 11.86 25.93 0.00 2.54 0.00 5.64 10.36 5.43 5.39 3.98 0.00 0.00 0.00 0.69 2.46 11.53 2.03 4.26 6.31 6.48 1.88 2.28 6.63 8.62 1.65 11.21 4.79 Asset Tangibimy 0.43 0.80 0.60 0.89 0.97 0.15 1.22 0.55 0.50 0.17 1.42 0.60 0.68 1.25 0.30 1.04 0.60 0.81 1.16 0.94 0.44 0.50 0.60 0.25 0.60 0.60 1.15 1.28 0.99 0.60 0.41 0.39 0.60 0.22 0.04 6.12 20.93 -0.42 62.16 11.76 24.62 0.00 15.39 49.60 8.10 18.74 4.50 0.00 5.45 0.10 30.16 23.04 42.32 0.00 0.43 25.85 28.75 32.75 20.05 32.04 -3.42 -7.39 -0.15 4.88 10.30 22.38 -8.05 6.63 -22.35 -16.15 33.60 -1.89 6.78 41 AMGEN INCO. 42 ANADARKO PETROLEUM CORP 43 ANALOG DEVICES INCO. 44 ANDREW CORPORATION 45 ANHEUSER-BUSCH COS.INCO. 46 AON CORP. 47 APACHE CORP. 48 APPLE COMPUTERS INCO. 49 APPLERA CORP. 50 APPLIED MATS.INCO. 51 APPD.MICRO CIRCUITS CORP 52 ARCHER-DANLS.-MIDL.CO. 53 ASHLAND 54 AUTOZONE INCO. 55 AUTODESK INCO. 56 AUTOMATIC DATA PROC. 57 AVAYA INCO. 58 AVERY DENNISON CORP. 59 AVON PRODUCTS INCO. 60 BB & T CORP. 61 BMC SOFTWARE INCO. 62 BAKER HUGHES INCO. 63 BALL CORP. 64 BANK ONE CORP. 65 BANK OF AMERICA CORP. 66 BANK OF NY.CO.INCO. 67 BARD CR INCO. 68 BARRICK GOLD CORP. 69 BAUSCH & LOMB INCO. 70 BAXTER INTL.INCO. 71 BEAR STEARNS COS.INCO. 72 3ECTON DICKINSON & CO. 73 BED BATH & BEYOND INCO. 74 BELLSOUTH CORP. 75 BEMIS CO.INCO. 76 BEST BUY CO.INCO. 0.54 26.176496 20.545984 4.092876 2.073232 14.689497 26.502992 12.416122 6.754996 2.126714 10.311618 1.224556 17.182864 7.005999 3.654922 1.01716 19.833664 3.686999 4.105299 3.425499 90.466544 2.808399 6.302199 4.0696 326.562816 736.444928 92.396976 1.679599 41.506264 2.999399 13.778997 212.16808 5.572251 2.188841 49.701984 2.292931 7.662997 9.32 8.00 6.42 1.71 16.47 2.92 12.78 1.19 10.07 0.00 0.00 4.47 3.74 16.80 13.62 5.65 0.00 8.38 21.67 1.70 1.84 3.08 7.53 1.72 1.84 1.63 12.48 5.39 5.82 7.68 1.13 11.33 18.34 9.29 6.89 1.57 0.21 1.31 0.43 0.29 1.12 0.60 1.47 0.17 0.60 0.30 0.12 0.77 0.42 0.70 0.24 0.09 0.45 0.61 0.50 0.60 0.26 0.58 0.67 0.60 0.60 0.60 0.23 0.60 0.45 0.56 0.60 0.70 0.33 1.34 0.71 0.40 4.36 -17.34 6.95 6.25 7.07 -8.28 0.37 10.74 -6.15 -5.48 -5.42 9.26 3.18 4.45 8.94 -10.39 7.76 24.97 4.70 0.00 23.55 41.45 35.24 26.60 8.67 10.01 25.65 28.24 33.20 42.82 23.44 0.00 30.14 25.73 10.82 6.77 18.80 5 Name 76 BEST BUY CO.INCO. 77 BIG LOTS INCO. 78 BIOGEN INCO. 79 BIOMET INCO. BO BLACK & DECKER CORP. B1 H&R BLOCK INCO. 82 BOEING CO. 83 OFFICEMAX INCORPORATED 84 BOSTON SCIENTIFIC CORP. 85 BRISTOL MYERS SQUIBB CO. B6 BROADCOM CORP. 87 BROWN-FORMAN CORP. 88 BRUNSWICK CORP. 89 BURL.NTHN.SANTA FE CORP 90 BURLINGTON RES.INCO. 91 CIENA CORP. 92 CIGNA CORP. 93 CINERGY CORP. 94 CMS ENERGY CORP. 95 COMPAQ COMPUTERS 96 CSX CORP. 97 CVS CORP. 98 CALPINE CORP. 99 CAMPBELL SOUP CO. 100 CAPITAL ONE FINL.CORP. 101 CARDINAL HEALTH INCO. 102 CARNIVAL CORP. 103 CATERPILLAR INCO. 104 CENDANT CORP. 105 CENTEX CORP. 106 CENTURYTEL INCO. 107 SCHWAB CHARLES CORP. 108 CHARTER ONE FINL. 109 CHEVRONTEXACO CORP. 10 CHIRON CORP. Debt Ratio 10.82 11.43 25.65 6.82 26.49 19.07 27.89 30.91 30.27 32.96 0.00 36.93 16.87 24.81 29.80 30.71 1.67 37.70 52.62 25.65 33.61 10.21 64.74 56.86 32.00 14.58 30.23 55.28 54.18 61.47 40.30 3.87 25.37 15.58 25.86 Size 7.662997 1.784265 41.506264 1.672168 4.222499 4.603904 51.792992 7.376158 5.698998 26.236992 2.028527 2.264 3.602499 26.938992 12.994998 2.378612 89.951952 14.119202 13.837996 41.506264 21.76 10.543099 27.30392 6.204997 46.283696 18.521392 24.490992 35.848992 38.368992 11.557605 7.895851 45.659984 42.628048 80.828944 4.195168 Growth Rate 18.80 8.40 3.18 14.73 -0.97 15.52 -0.95 1.84 9.27 4.68 13.67 3.15 2.70 0.75 11.06 -30.92 -1.74 -19.36 -15.07 3.18 -1.65 9.80 57.79 2.14 21.73 23.84 21.14 4.11 68.62 15.25 8.85 -15.37 2.64 33.64 23.14 Profitability 1.57 5.66 5.39 19.03 8.15 15.16 2.49 1.94 11.29 13.22 0.00 12.41 4.76 4.24 12.89 0.00 0.85 4.98 2.48 5.39 2.49 9.16 3.48 12.55 4.26 9.02 10.72 4.91 4.67 7.13 6.36 1.28 2.22 10.03 8.10 Asset Tangibility 0.40 0.70 0.60 0.28 0.37 0.17 0.41 0.84 0.23 0.36 0.17 0.44 0.48 1.16 1.33 0.17 0.60 1.04 0.85 0.60 0.90 0.38 0.81 0.65 0.60 0.20 0.83 0.40 0.35 0.10 0.91 0.60 0.60 1.25 0.29 16.23 11.84 12.20 -2.07 -0.09 -5.39 10.10 7.76 15.16 0.50 0.95 5.52 1.91 30.70 -6.87 -20.07 0.60 0.60 0.49 0.42 0.22 0.60 0.82 0.12 0.22 0.58 0.36 0.53 0.68 0.23 0.60 0.13 6.59 0.40 111 CHUBB CORP 112 CINCINNATI FIN. 113 CINTAS CORP. 114 CIRCUIT CITY INCO. 115 CISCO SYSTEMS INCO. 116 CITIGROUP INCO. 117 CTZN.COMMS.CORP. 118 CITRIX SYS.INCO. 119 CLEAR CHL.COMMS.INCO. 120 CLOROX CO. 121 COCA COLA CO. 122 COCA COLA ENTS. 123 COLGATE-PALM.CO. 124 COMCAST CORP. 125 COMERICA INCO. 126 CMP.ASSOCS.INTL. 127 COMPUTER SCIS.CORP. 128 COMPUWARE CORP. 129 COMVERSE TECH.INCO. 130 CONAGRA FOODS INCO. 131 CONCORD EFS INCO. 132 CONEXANT SYS. 133 CONOCO INCO. 134 CONSECO INCO. 135 CONS.EDISON INCO. 136 CONSTELLATION EN. 137 CONVERGYS CORP. 138 COOPER INDS.LTD. 139 COOPER TIRE RUB. 140 MOLSON COORS BREWING CO. 141 CORNING INCO. 142 COSTCO WHOLESALE CORP. 143 COUNTRYWIDE FINL.CORP. 144 CRANE CO. 145 CUMMINS INCO. 146 DTE ENERGY CO. 7.46 3.89 21.80 0.34 0.00 32.32 64.31 26.19 24.92 29.27 20.16 45.32 41.49 24.73 9.63 28.28 23.77 0.00 20.06 39.35 25.65 84.27 25.65 25.65 34.88 35.51 7.45 27.05 30.60 29.22 29.54 10.20 73.44 23.20 32.02 41.04 37.737088 15.508996 2.582945 3.776754 35.630992 1264.030976 7.689109 1.34177 28.352 3.652 26.895984 25.699984 7.478796 109.158976 52.591984 11.053998 10.433196 2.10251 2.728041 15.071399 41.506264 0.690447 41.506264 41.506264 20.336992 15.718899 1.810199 4.965298 2.868866 4.281421 9.526996 13.177368 97.949776 1.707538 4.462997 20.752992 -14.89 -14.49 -7.89 22.69 -34.17 3.18 3.18 1.38 35.75 1.91 -3.07 0.40 18.27 -24.31 9.77 58.39 3.14 -1.54 7.95 2.67 2.82 10.70 2.02 9.90 1.88 5.76 12.03 5.07 14.09 18.49 4.42 21.25 4.04 1.38 0.00 6.21 5.50 0.00 6.41 13.82 0.00 5.39 5.39 4.51 3.57 10.88 4.21 4.38 5.58 0.00 6.41 6.30 8.45 2.78 4.81 0.24 0.14 0.36 0.60 0.25 0.60 0.60 0.95 0.87 0.59 0.39 0.89 0.97 0.74 0.68 0.60 0.45 0.70 0.85 147 DANA CORP. 148 DANAHER CORP. 149 DARDEN RESTAURANTS INCO. 150 DEERE & CO. 151 DELL INCO. 152 DELPHI AUTV.SYS.CORP. 153 DELTA AIR LINES INCO. 154 DELUXE CORP. 155 DEVON ENERGY CORP. 156 DILLARDS INCO. 157 DOLLAR GENERAL CORP. 158 DOMINION RES.INCO. 159 DONNELLEY R R & SONS CO. 160 DOVER CORP. 161 DOW CHEMICALS CO. 162 DOW JONES & CO.INCO. 163 DU PONT E I DE NEMOURS 164 DUKE ENERGY CORP. 165 DYNEGY INCO. 166 EMC CORP. 167 EOG RES.INCO. 168 EASTMAN CHEMS.CO. 169 EASTMAN KODAK CO. 170 EATON CORP 171 ECOLAB INCO. 172 EDISON INTL.INCO. 173 EL PASO CORP. 174 ELECTRONIC DTSY.CORP. 175 EMERSON ELECTRIC CO. 176 ENGELHARD CORP. 177 ENRON CORP. 178 ENTERGY CORP. 179 EQUIFAX INCO. 180 EQUITY OFFE.PROPS.TST. 181 EXELON 182 EXXON MOBIL CORP 33.35 18.85 24.68 59.52 2.63 18.95 49.28 107.24 32.83 40.91 10.63 42.04 29.11 20.80 34.70 11.90 28.39 39.88 46.79 0.98 23.76 42.26 22.49 25.02 21.18 41.04 59.54 32.92 27.14 15.79 25.65 29.51 53.02 47.45 38.26 548 9.287999 6.890049 2.666211 24.781888 19.177984 17.068992 25.486992 0.56296 27.161984 6.411096 2.652708 43.958992 3.188949 5.13375 37.777984 1.286759 35.984992 55.050992 13.300998 14.020837 4.667502 6.187999 14.439997 7.804997 3.185749 34.961984 37.000992 17.506992 15.193997 2.906099 41.506264 27.723664 1.553299 24.189008 41.190992 174 277984 -13.86 11.90 7.94 5.72 9.13 -1.21 -7.38 -0.55 38.22 -3.92 14.73 9.26 -6.00 -6.51 12.35 -11.08 -1.92 -22.72 41.86 -11.09 7.11 3.10 -1.64 -1.00 18.44 1.96 -32.63 3.76 -3.53 -12.49 3.18 -2.81 -14.58 12.32 28.23 3.91 9.55 10.32 4.75 17.37 0.48 0.00 30.67 12.82 1.82 13.79 2.54 6.65 7.53 6.36 15.18 3.52 0.00 5.47 5.22 12.29 0.00 2.80 6.21 10.91 5.08 0.00 0.00 8.60 8.43 5.39 4.81 12.68 4.76 4.14 14 18 0.48 0.22 1.32 0.29 0.14 0.90 1.02 0.75 1.04 0.79 0.64 0.83 1.52 0.37 1.08 1.35 0.67 0.85 0.74 0.21 1.77 1.59 0.92 0.54 0.58 0.74 1.01 0.48 0.45 0.73 0.60 1.14 0.10 0.60 0.67 1.32
Step by Step Solution
There are 3 Steps involved in it

Get step-by-step solutions from verified subject matter experts