

Question: there is no additional info . they only gave us this info. The following table of information is useful for task 1, task 2 and
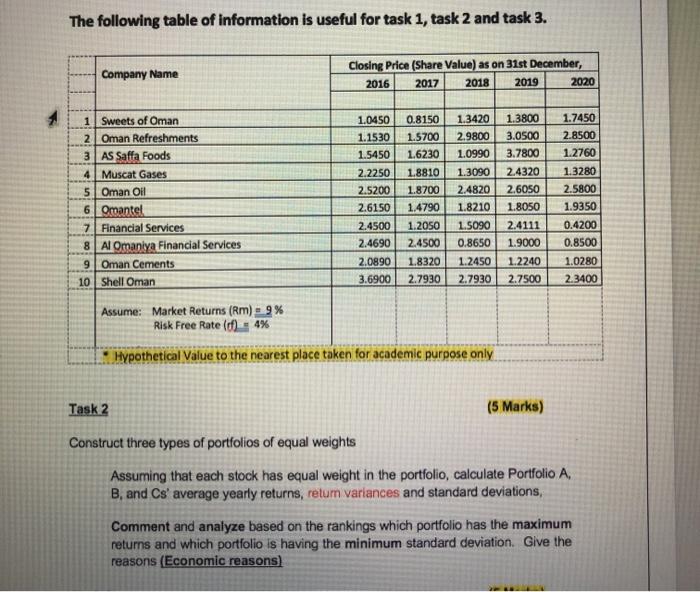
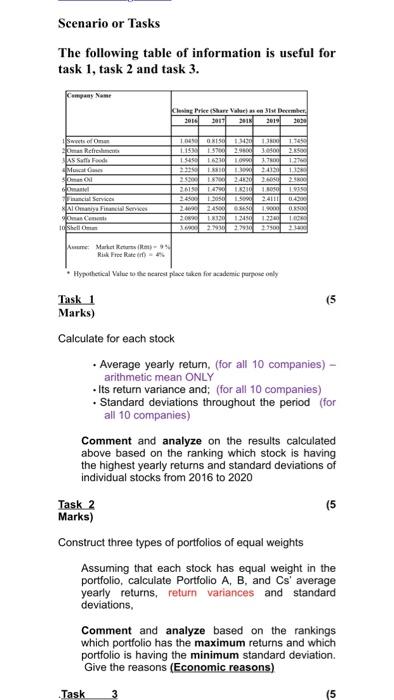
The following table of information is useful for task 1, task 2 and task 3. Company Name Closing Price (Share Value) as on 31st December, 2016 2017 2018 2019 2020 1.3800 3.0500 3.7800 1 Sweets of Oman 2 Oman Refreshments 3 AS Saffa Foods 4 Muscat Gases 5 Oman Oil 6 Omantel 7. Financial Services 8 Almaniya Financial Services 9 Oman Cements 10 Shell Oman 1.0450 1.1530 1.5450 2.2250 2.5200 2.6150 2.4500 2.4690 2.0890 3.6900 0.8150 1.5700 1.6230 1.8810 1.8700 1.4790 1.2050 2.4500 1.8320 2.7930 1.3420 2.9800 1.0990 1.3090 2.4820 1.8210 1.5090 0.8650 1.2450 2.7930 2.4320 2.6050 1.8050 2.4111 1.9000 1.2240 2.7500 1.7450 2.8500 1.2760 1.3280 2.5800 1.9350 0.4200 0.8500 1.0280 2.3400 Assume: Market Returns (Rm) 9% Risk Free Rate (c) = 4% Hypothetical Value to the nearest place taken for academic purpose only Task 2 (5 Marks) Construct three types of portfolios of equal weights Assuming that each stock has equal weight in the portfolio, calculate Portfolio A. B, and Cs' average yearly returns, retum variances and standard deviations, Comment and analyze based on the rankings which portfolio has the maximum returns and which portfolio is having the minimum standard deviation. Give the reasons (Economic reasons) Scenario or Tasks The following table of information is useful for task 1, task 2 and task 3. lesing Price (Share Varenummer 2016 2011 2019 200 Set of Retro AS Safe Food Muscat sol 10 1.15 1.450 30 2015 ONIS 1.13 1 2.90 3.000 2.500 10990 2700 27 11 180 200 E 2500 14 1230 1.000 1 13050 1.5 24111 40 24500 1.000 13 1.3456 10 2. 10 nancial Service Almaniya Financial Services 2009 Am Market Rike Free Run . Hypothetical Value to the carost place taken for academic purpose only (s Task 1 Marks) Calculate for each stock Average yearly return, (for all 10 companies) - arithmetic mean ONLY Its return variance and; (for all 10 companies) Standard deviations throughout the period (for all 10 companies) Comment and analyze on the results calculated above based on the ranking which stock is having the highest yearly returns and standard deviations of individual stocks from 2016 to 2020 Task 2 Marks) Construct three types of portfolios of equal weights Assuming that each stock has equal weight in the portfolio, calculate Portfolio A, B, and Cs' average yearly returns, return variances and standard deviations, Comment and analyze based on the rankings which portfolio has the maximum returns and which portfolio is having the minimum standard deviation. Give the reasons (Economic reasons) (5 Task 3 (5
Step by Step Solution
There are 3 Steps involved in it

Get step-by-step solutions from verified subject matter experts