

Question: There is one questions for Set 1 The copyable version of chart is down below. Set 1 The unemployment rates in Canada during a 19-year
- There is one questions for Set 1
- The copyable version of chart is down below.
Set 1
The unemployment rates in Canada during a 19-year period (2001 - 2019) are shown in the table on the left
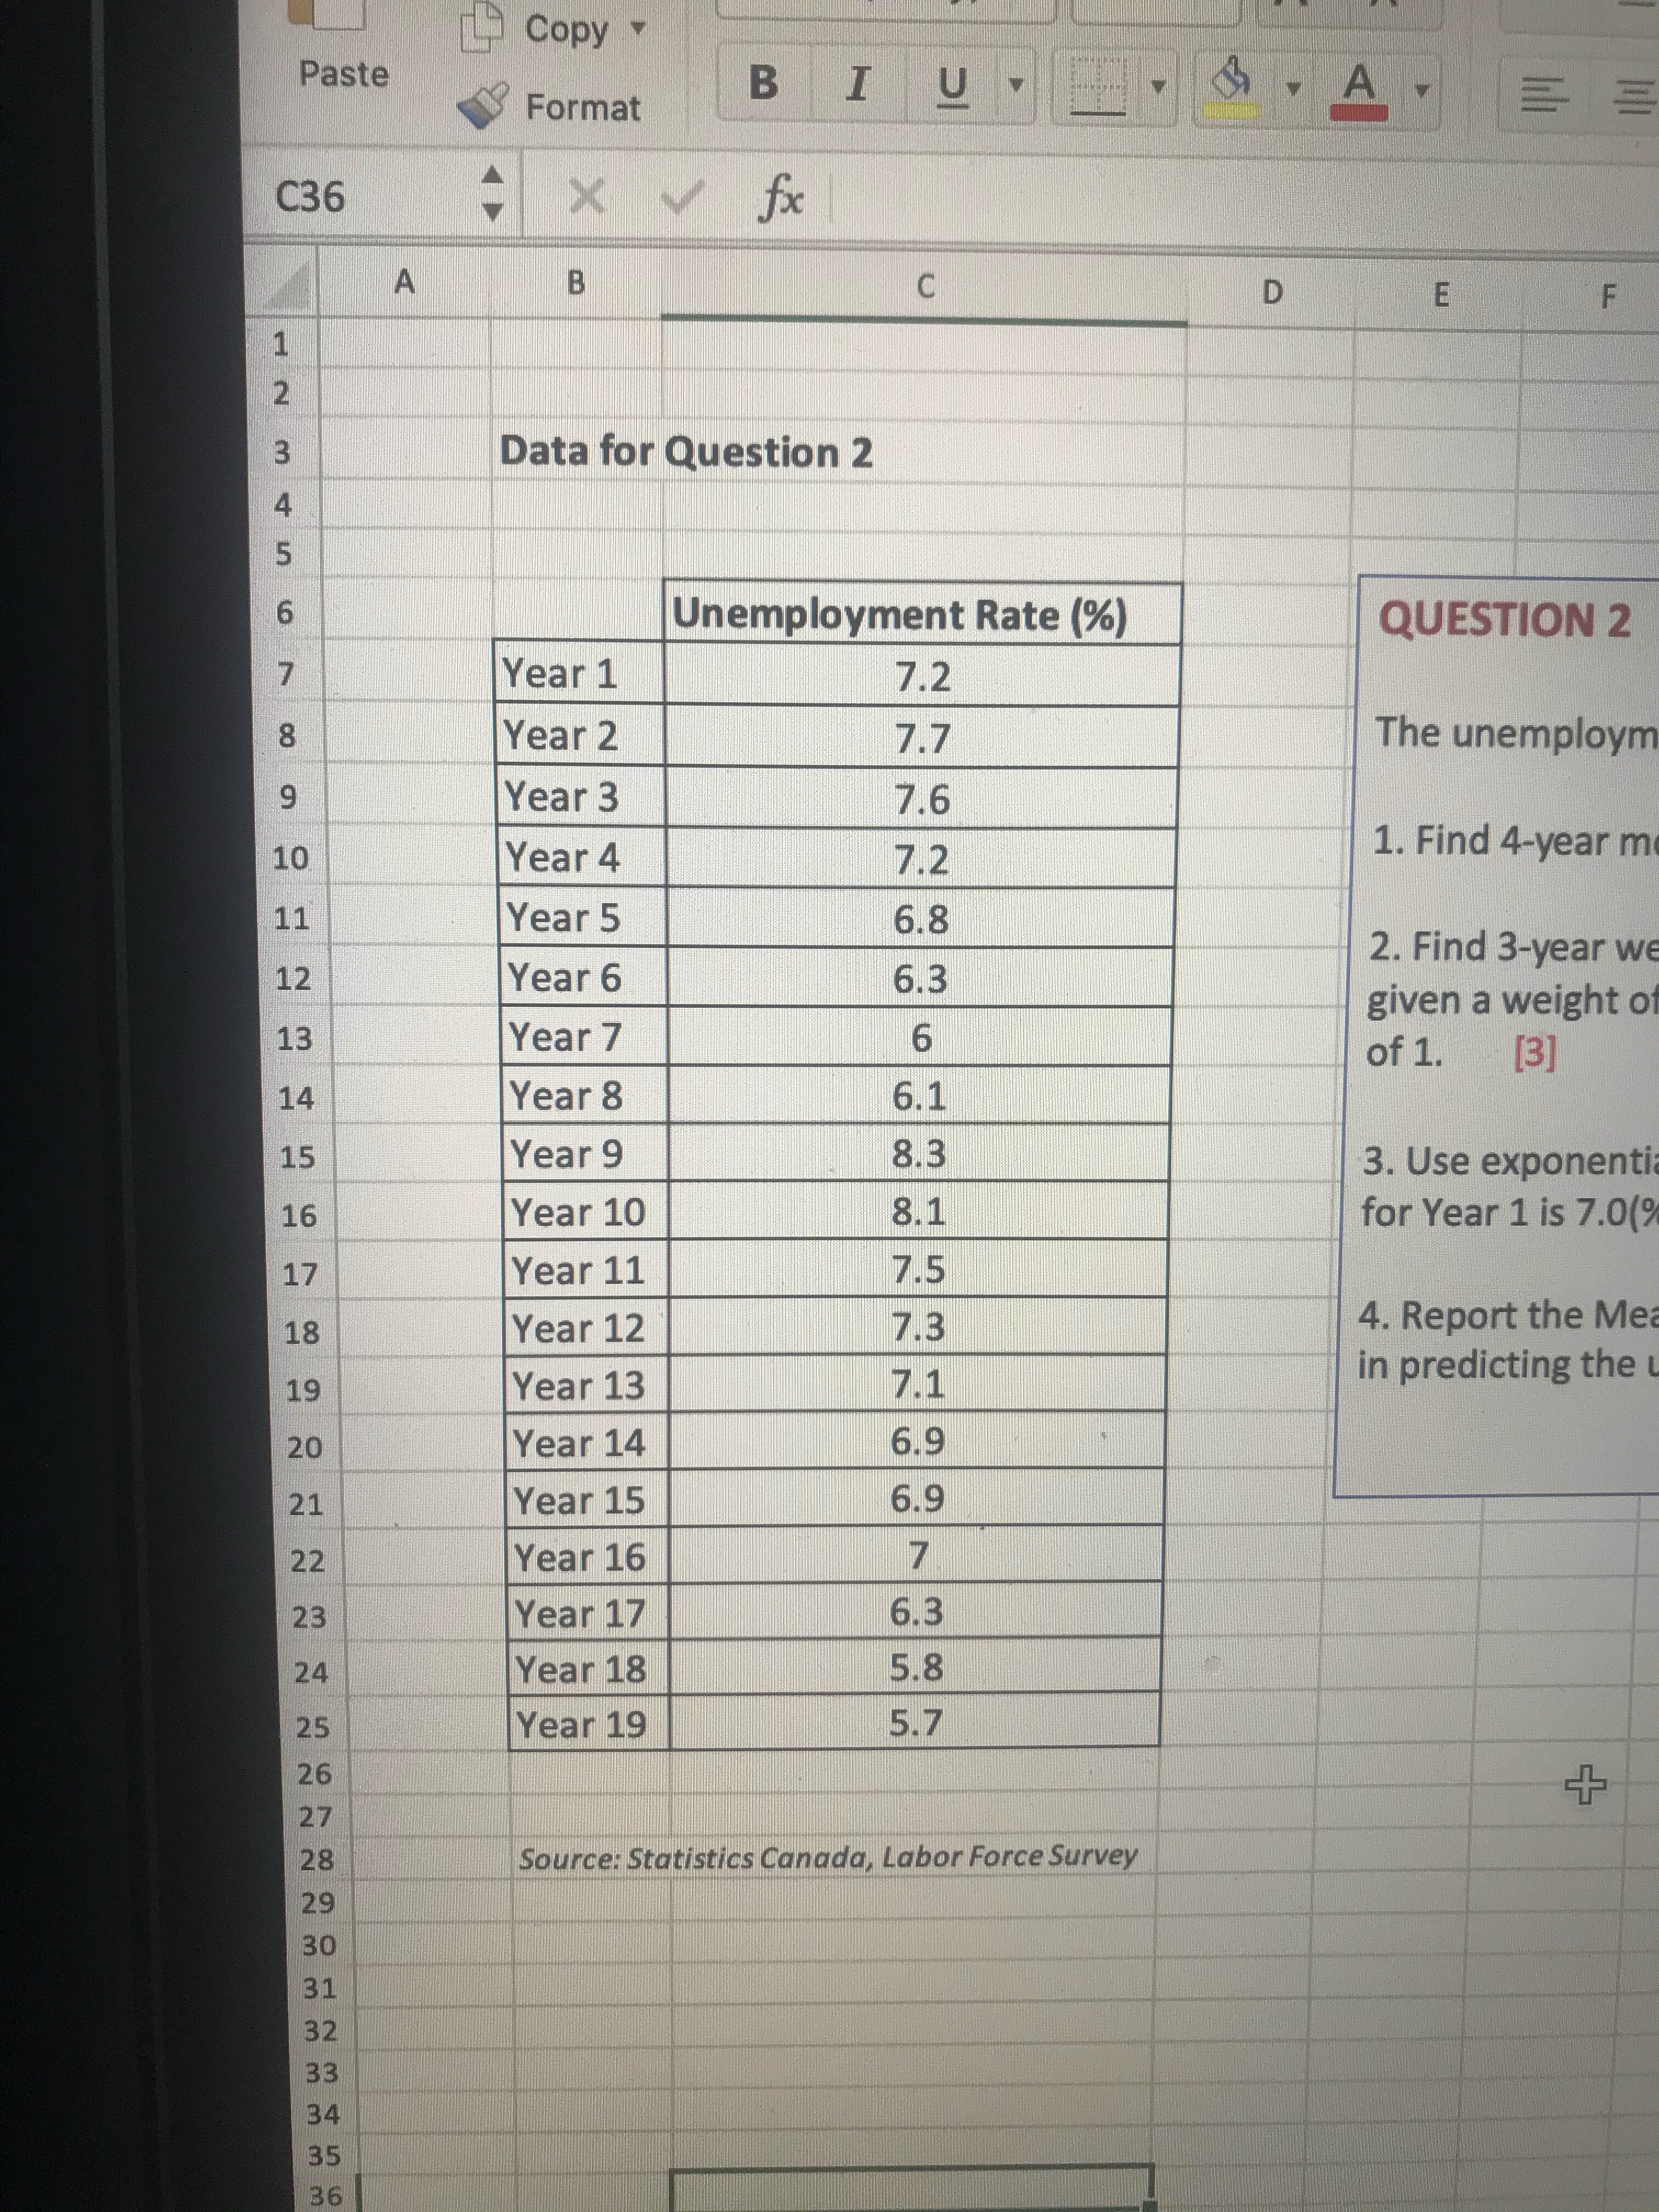
Copy Paste Format B I U KSS A E E C36 X V A B C D E F N P A W Data for Question 2 Unemployment Rate (%) QUESTION 2 Year 1 7.2 Year 2 7.7 The unemploym 9 Year 3 7.6 10 Year 4 7.2 1. Find 4-year m 11 Year 5 6.8 12 Year 6 6.3 2. Find 3-year we Year 7 given a weight of 13 6 of 1. [3] 14 Year 8 6.1 15 Year 9 8.3 3. Use exponenti 16 Year 10 8.1 for Year 1 is 7.0(9) 17 Year 11 7.5 18 Year 12 7.3 4. Report the Mea 19 Year 13 7.1 in predicting the 20 Year 14 6.9 21 Year 15 6.9 22 Year 16 7 23 Year 17 6.3 24 Year 18 5 .8 25 Year 19 5.7 26 27 + 28 Source: Statistics Canada, Labor Force Survey 29 30 31 32 33 34 35 36
Step by Step Solution
There are 3 Steps involved in it

Get step-by-step solutions from verified subject matter experts