

Question: There is some additional data to add from 1999 onwards. I need to calculate the P value and do a chi square analysis or correlational
There is some additional data to add from 1999 onwards. I need to calculate the P value and do a chi square analysis or correlational analysis for the information below. 1999 -0.14 -0.062000 -0.14 -0.062001 -0.13 -0.062002 -0.13 -0.062003 -0.12 -0.062004 -0.12 -0.062005 -0.11 -0.052006 -0.1-0.052007 -0.1 ?0.052008 -0.1 ?0.042009 -0.09 ?0.042010 -0.09 -0.042011. -0.09-0.042012 -0.09-0.042013 -0.09-0.032014 -0.09-0.032015 -0.08-0.032016 -0.08-0.032017 -0.08-0.03
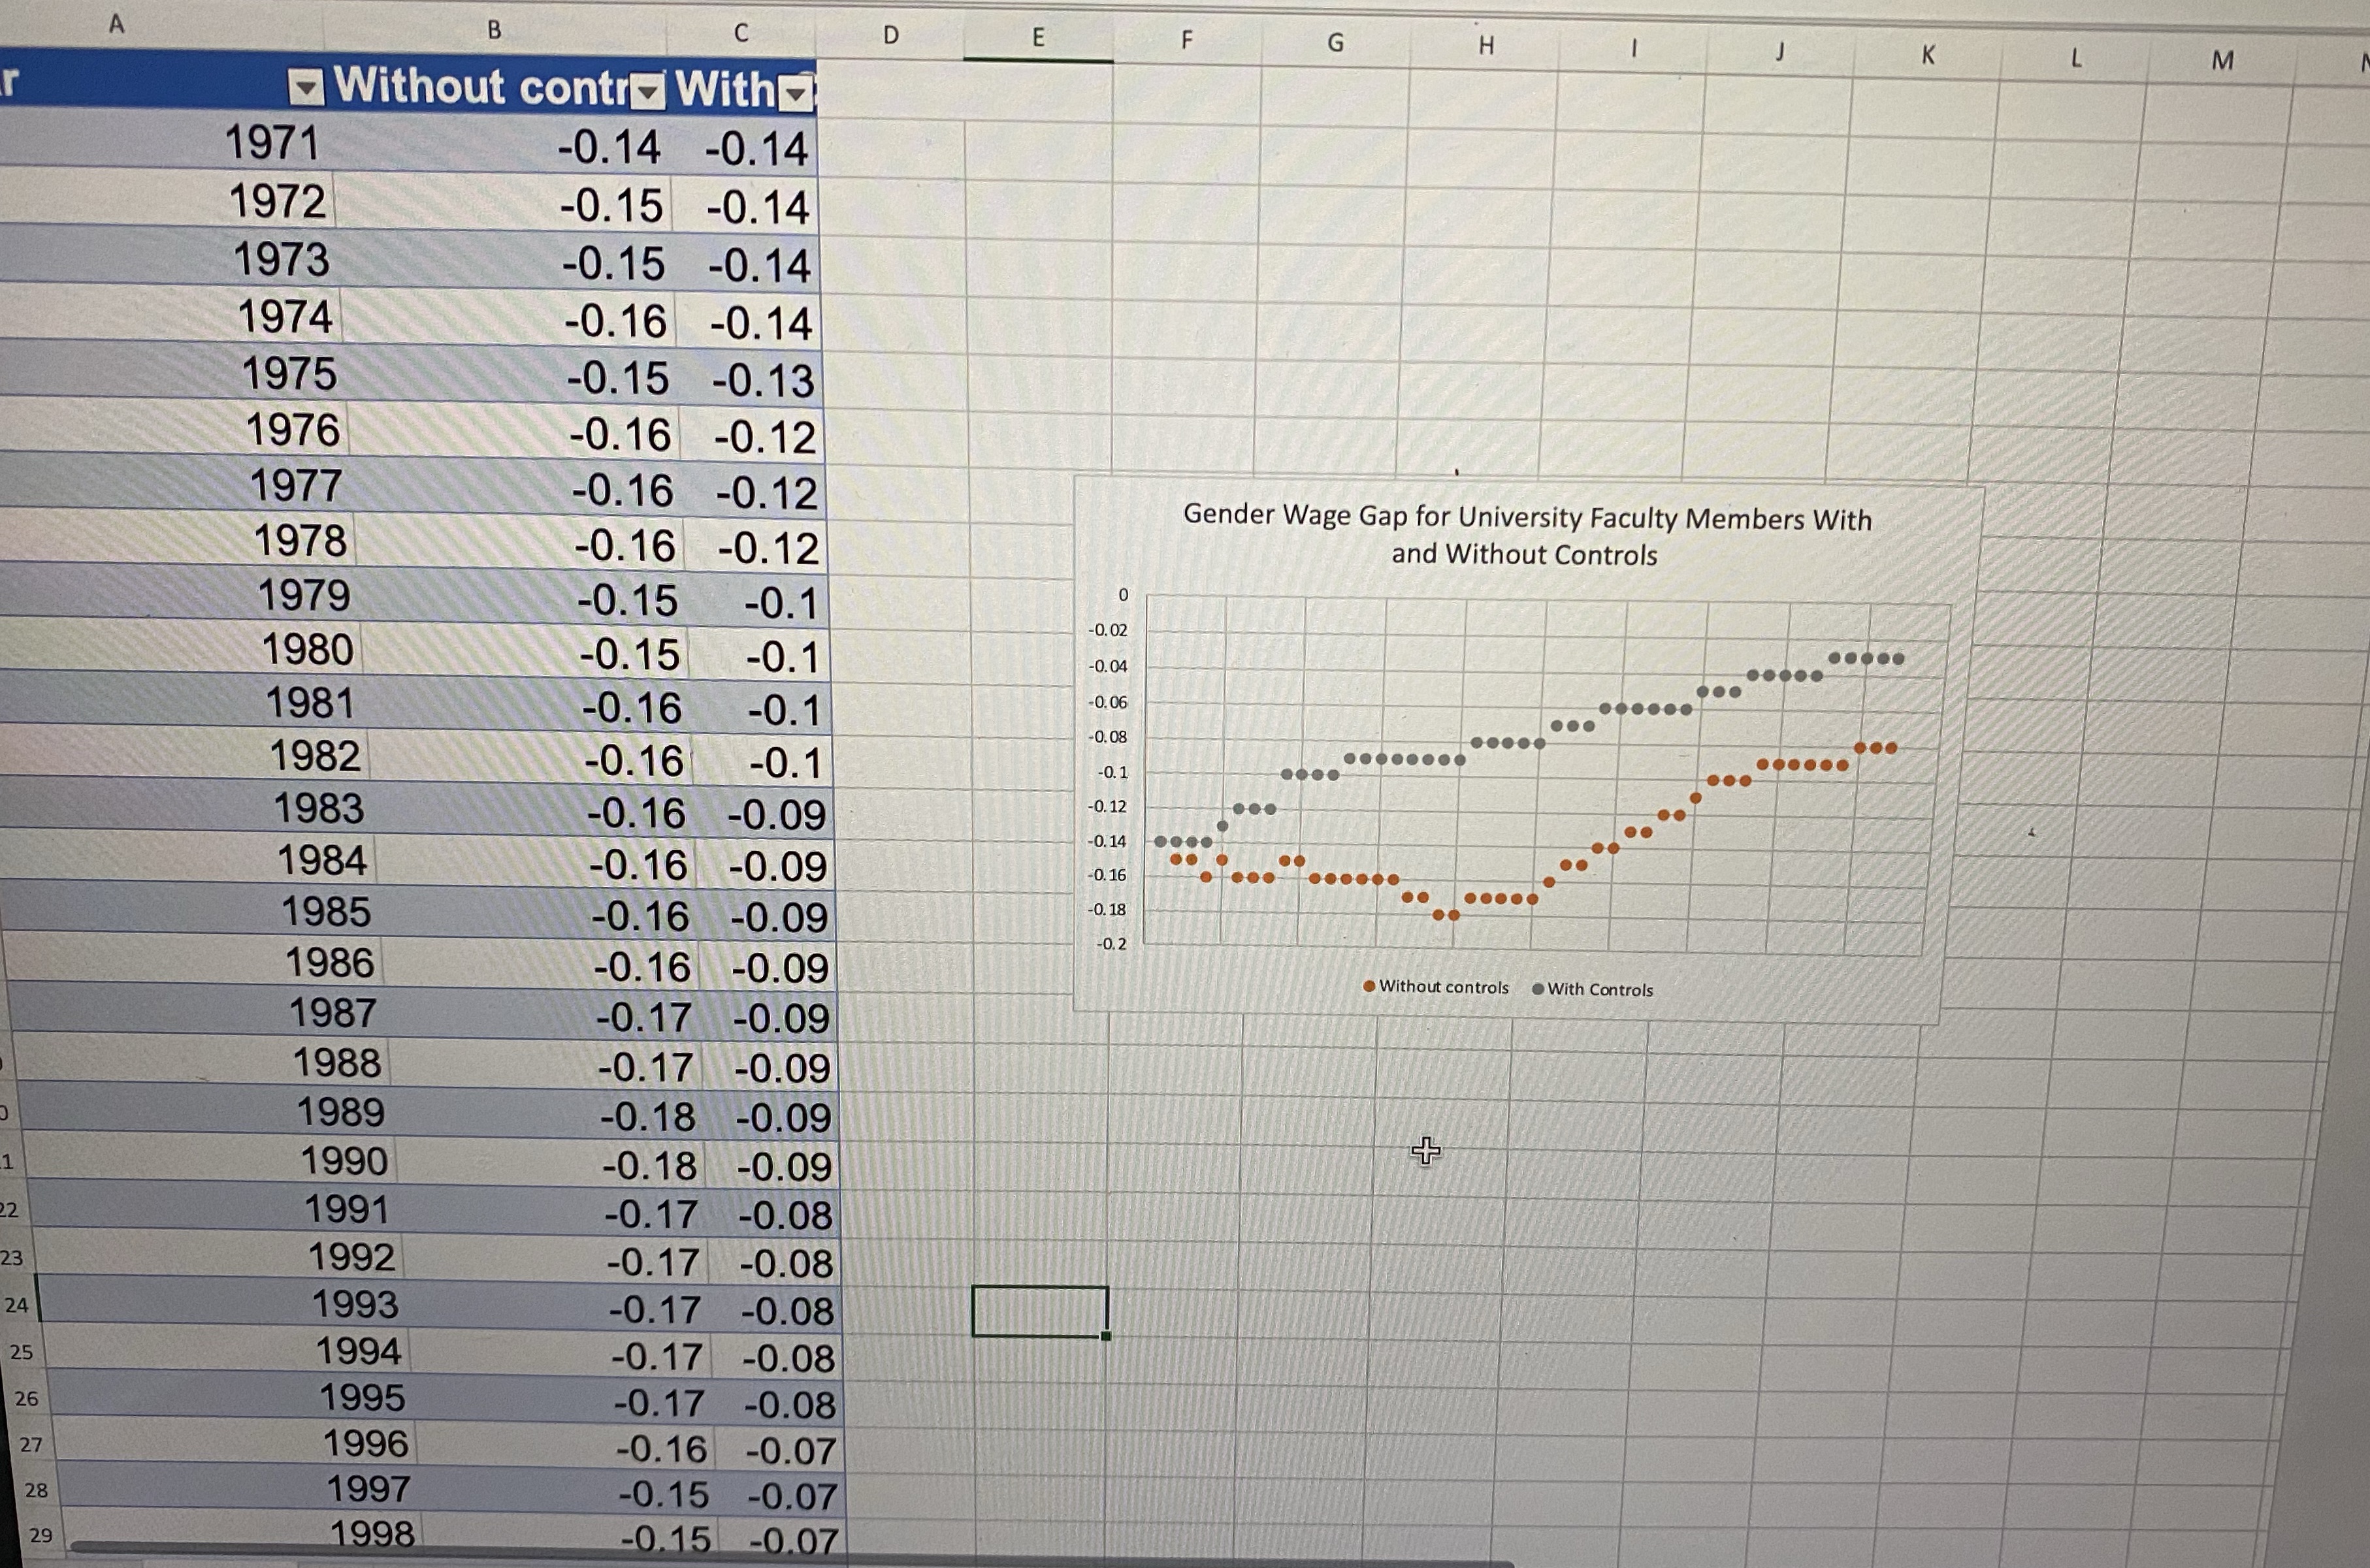
A B C D E F G H K L M Without contre With 1971 -0.14 -0.14 1972 -0.15 -0.14 1973 -0.15 -0.14 1974 -0.16 -0.14 1975 -0.15 -0.13 1976 -0.16 -0.12 1977 -0.16 -0.12 1978 Gender Wage Gap for University Faculty Members With -0.16 -0.12 and Without Controls 1979 -0. 15 -0.1 0 1980 0.02 -0.15 -0.1 0. 04 1981 -0. 16 -0.1 0.06 . .. ...... -0.08 1982 -0. 16 ..... -0.1 ... -0. 1 .... ....... ...... 1983 -0.16 -0.09 -0. 12 1984 0. 14 -0.16 -0.09 0. 16 ... ...... .. 1985 .. -0.16 -0.09 0. 18 ..... 1986 -0.16 -0.09 .Without controls . With Controls 1987 -0.17 -0.09 1988 -0.17 -0.09 1989 -0.18 -0.09 1990 -0.18 -0.09 + 1991 -0.17 -0.08 1992 -0.17 -0.08 24 1993 -0.17 -0.08 25 1994 -0.17 -0.08 26 1995 -0.17 -0.08 27 1996 -0.16 -0.07 28 1997 -0.15 -0.07 29 1998 -0.15 -0.07
Step by Step Solution
There are 3 Steps involved in it

Get step-by-step solutions from verified subject matter experts