

Question: Therefore, the control limits for the sample ranges for the car wash process are 26.10 seconds and 1.90 seconds. Note that x represents a sample
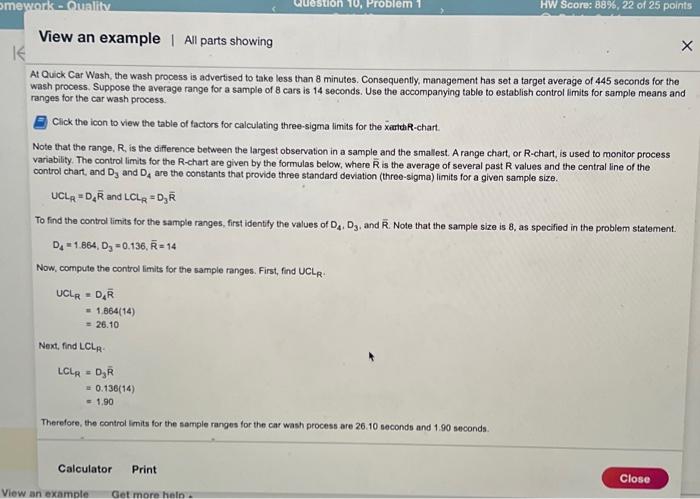
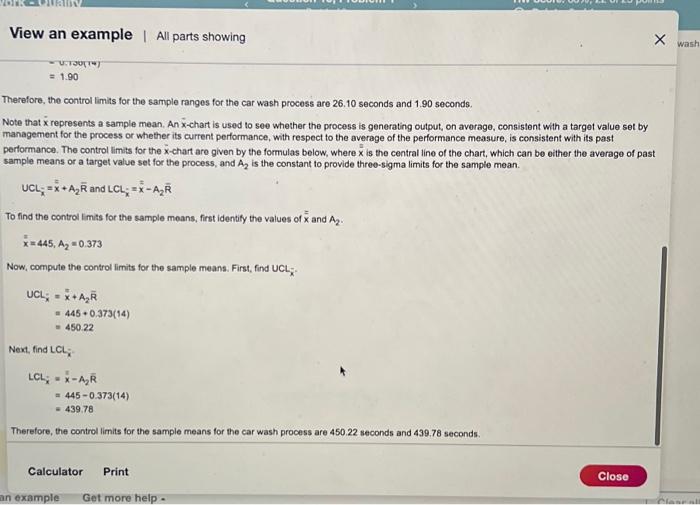
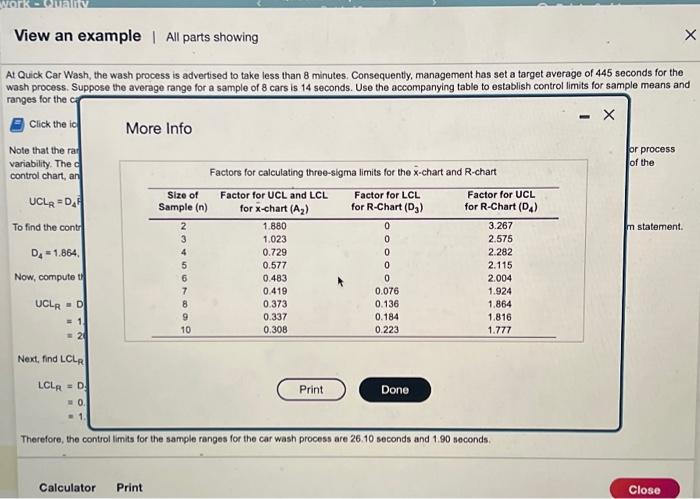
Therefore, the control limits for the sample ranges for the car wash process are 26.10 seconds and 1.90 seconds. Note that x represents a sample mean. An x-chart is used to see whether the process is generating output, on average, consistent with a target value set by management for the process or whether its current performance, with respect to the average of the performance measure, is consistent with its past performance. The control limits for the x-chart are given by the formulas below, where x is the central line of the chart, which can be either the average of past sample means or a target value set for the process, and A2 is the constant to provide three-sigma limits for the sample mean. UCLx=x+A2RandLCLx=xA2R To find the control limis for the sample moans, first identify the values of x and A2. x=445,A2=0.373 Now, compute the control limits for the sample means. First, find UCLx UCz=x+A2R=445+0.373(14)=450.22 Next, find LCl; LCL=xA2R=4450.373(14)=439.78 Therefore, the control limits for the sample means for the car wash process are 450.22 seconds and 439.78 seconds. Therefore, the control limits for the sample ranges for the car wash process are 26.10 seconds and 1.90 seconds. Note that x represents a sample mean. An x-chart is used to see whether the process is generating output, on average, consistent with a target value set by management for the process or whether its current performance, with respect to the average of the performance measure, is consistent with its past performance. The control limits for the x-chart are given by the formulas below, where x is the central line of the chart, which can be either the average of past sample means or a target value set for the process, and A2 is the constant to provide three-sigma limits for the sample mean. UCLx=x+A2RandLCLx=xA2R To find the control limis for the sample moans, first identify the values of x and A2. x=445,A2=0.373 Now, compute the control limits for the sample means. First, find UCLx UCz=x+A2R=445+0.373(14)=450.22 Next, find LCl; LCL=xA2R=4450.373(14)=439.78 Therefore, the control limits for the sample means for the car wash process are 450.22 seconds and 439.78 seconds
Step by Step Solution
There are 3 Steps involved in it

Get step-by-step solutions from verified subject matter experts