

Question: These all the variables given! Factors for calculating three-sigma limits for the x-chart and R-chart Factor for LCL for R-Chart (D3) Size of Sample Factor
These all the variables given!
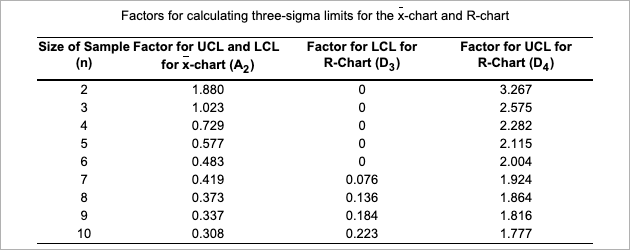
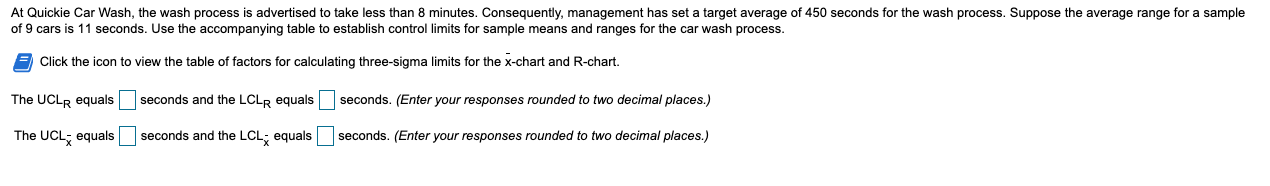
Factors for calculating three-sigma limits for the x-chart and R-chart Factor for LCL for R-Chart (D3) Size of Sample Factor for UCL and LCL for X-chart (A2) 2 1.880 3 1.023 4 0.729 5 0.577 6 0.483 7 0.419 8 0.373 9 0.337 10 0.308 0 0 0 0 0 0.076 0.136 0.184 0.223 Factor for UCL for R-Chart (D4) 3.267 2.575 2.282 2.115 2.004 1.924 1.864 1.816 1.777 At Quickie Car Wash, the wash process is advertised to take less than 8 minutes. Consequently, management has set a target average of 450 seconds for the wash process. Suppose the average range for a sample of 9 cars is 11 seconds. Use the accompanying table to establish control limits for sample means and ranges for the car wash process. Click the icon to view the table of factors for calculating three-sigma limits for the x-chart and R-chart. The UCLR equals seconds and the LCLR equals seconds. (Enter your responses rounded to two decimal places.) The UCL; equals seconds and the LCL; equals seconds. (Enter your responses rounded to two decimal places.)Step by Step Solution
There are 3 Steps involved in it
1 Expert Approved Answer
Step: 1 Unlock

Question Has Been Solved by an Expert!
Get step-by-step solutions from verified subject matter experts
Step: 2 Unlock
Step: 3 Unlock