

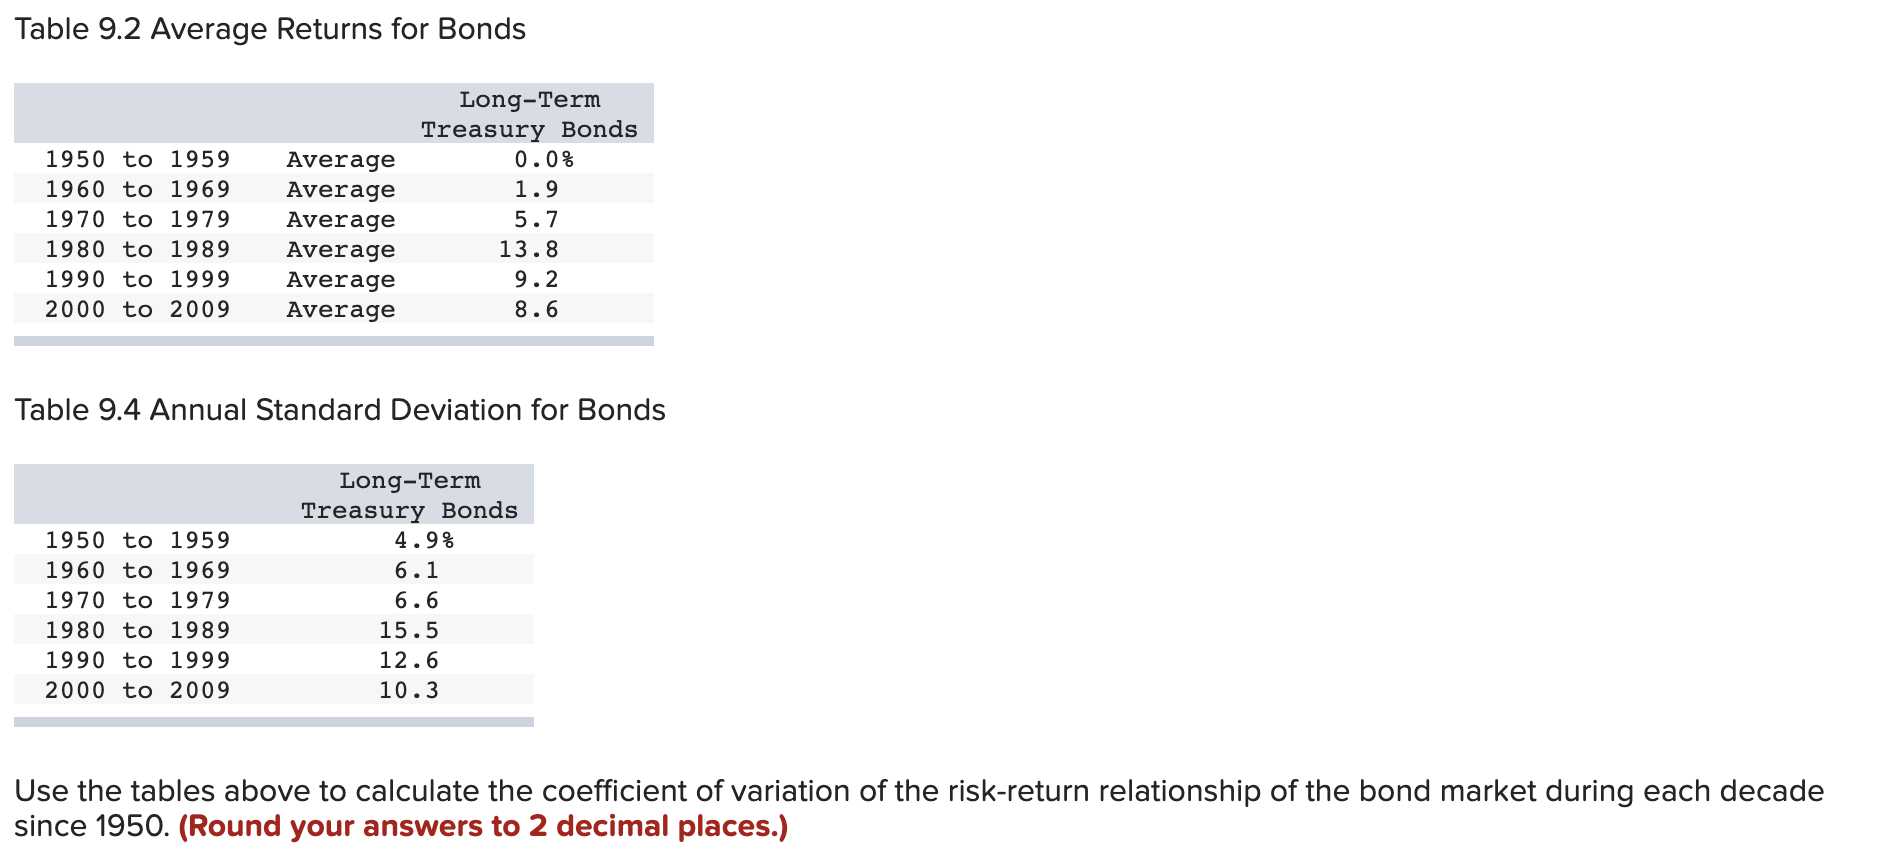
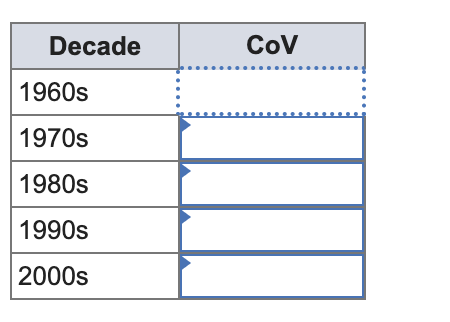
Question: These answers did not work: Table 9.2 Average Returns for Bonds Table 9.4 Annual Standard Deviation for Bonds Use the tables above to calculate the
 These answers did not work:
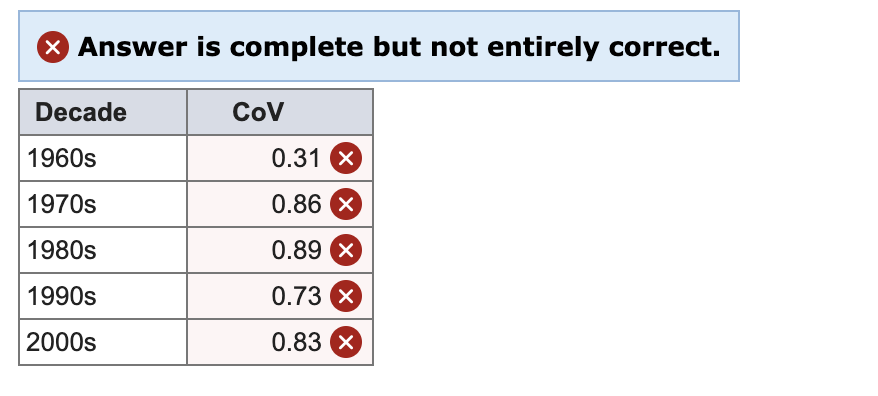
Table 9.2 Average Returns for Bonds Table 9.4 Annual Standard Deviation for Bonds Use the tables above to calculate the coefficient of variation of the risk-return relationship of the bond market during each decade since 1950. (Round your answers to 2 decimal places.) \begin{tabular}{|l|l|} \hline \multicolumn{1}{|c|}{ Decade } & CoV \\ \hline 1960s & .. \\ \hline 1970s & \\ \hline 1980s & \\ \hline 1990s & \\ \hline 2000s & \\ \hline \end{tabular} Answer is complete but not entirely correct
Step by Step Solution
There are 3 Steps involved in it
1 Expert Approved Answer
Step: 1 Unlock

Question Has Been Solved by an Expert!
Get step-by-step solutions from verified subject matter experts
Step: 2 Unlock
Step: 3 Unlock