

Question: These are also needed but the below are examples and not specific numbers related to the actual problem numbers. In its annual report, WYZ Athletic
These are also needed but the below are examples and not specific numbers related to the actual problem numbers.
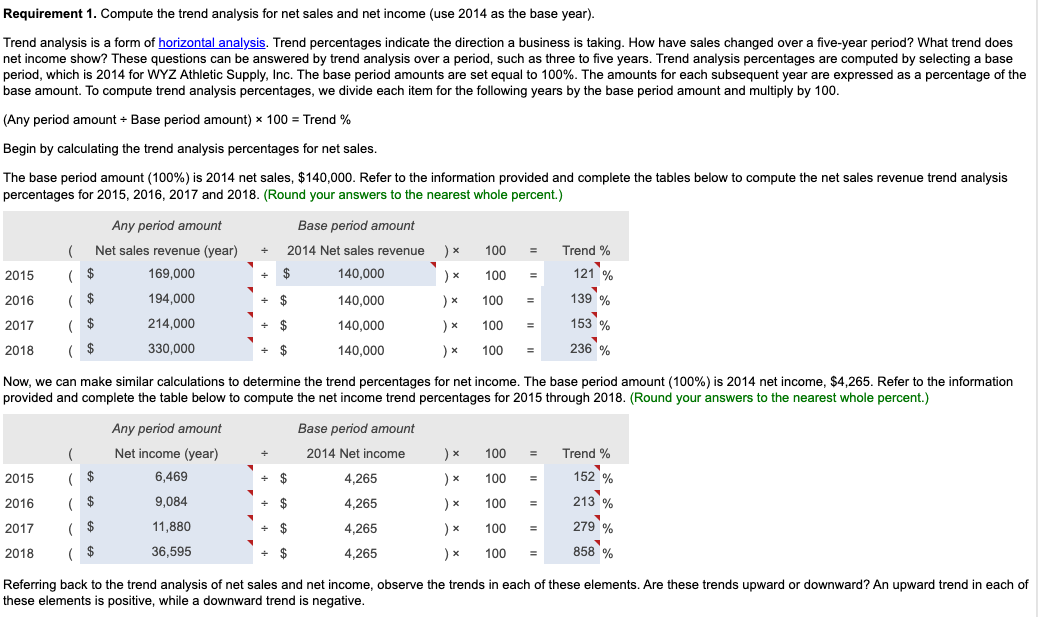
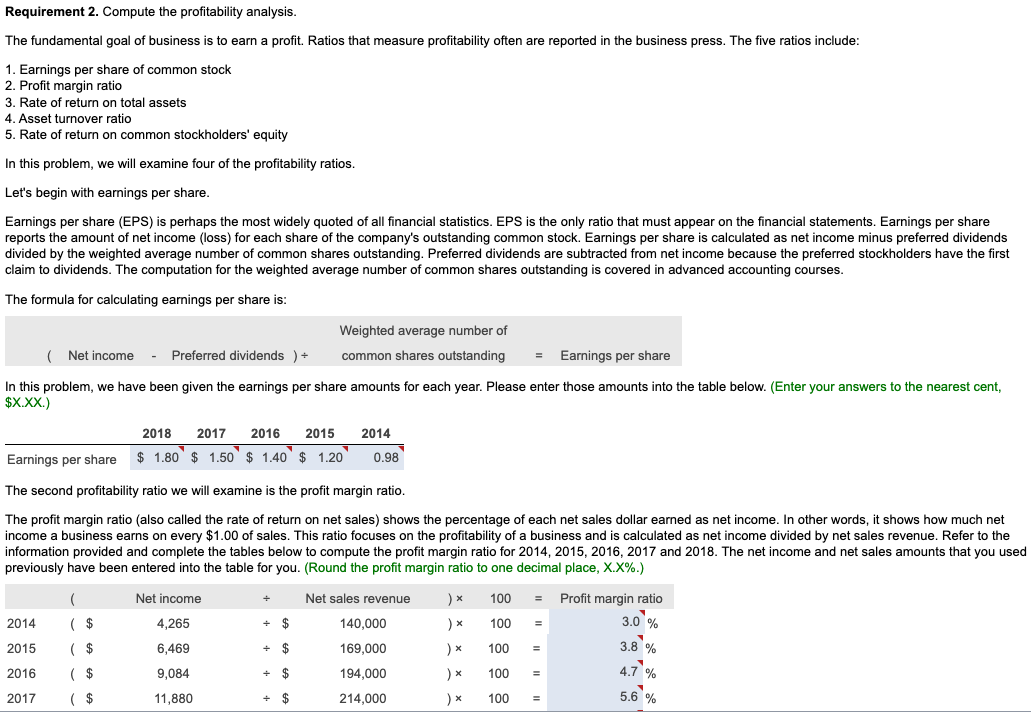
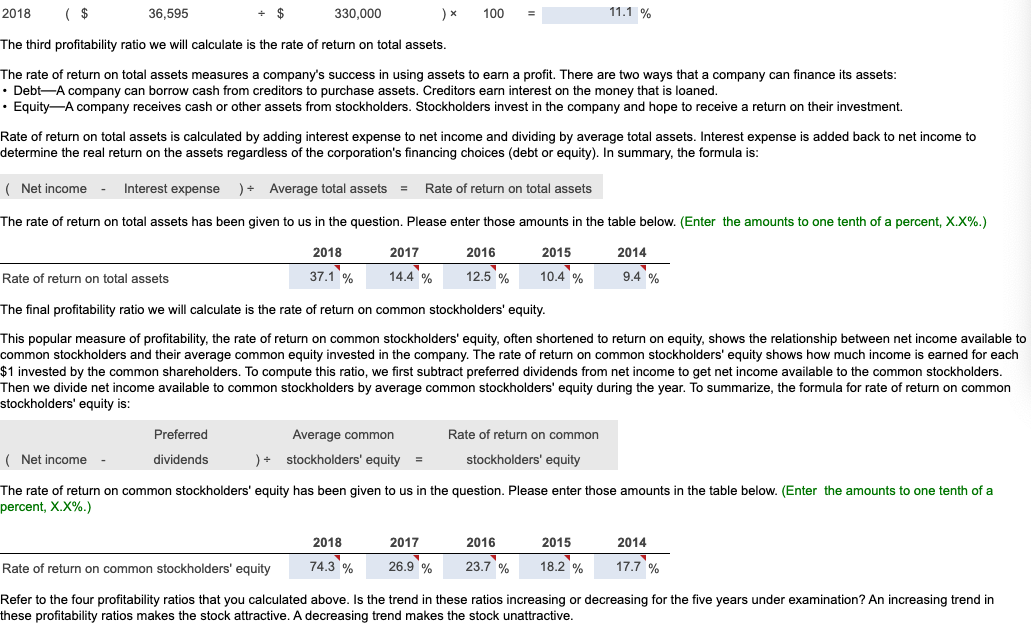
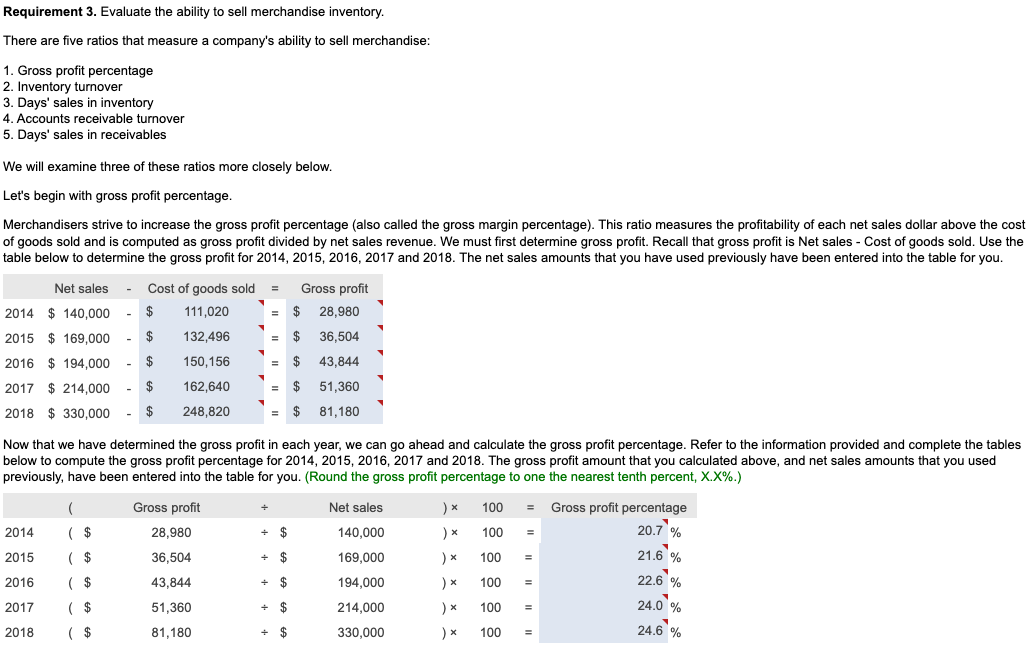
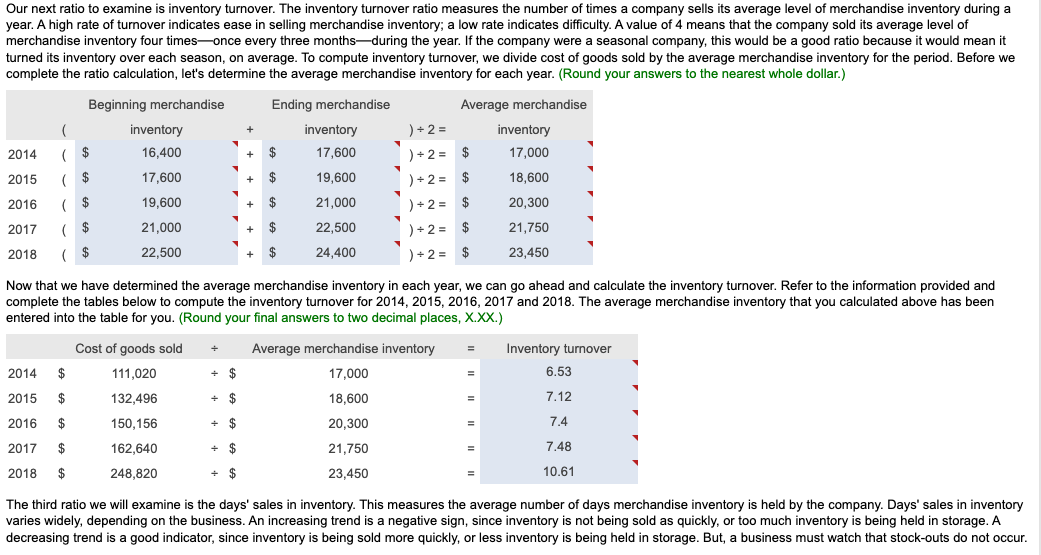
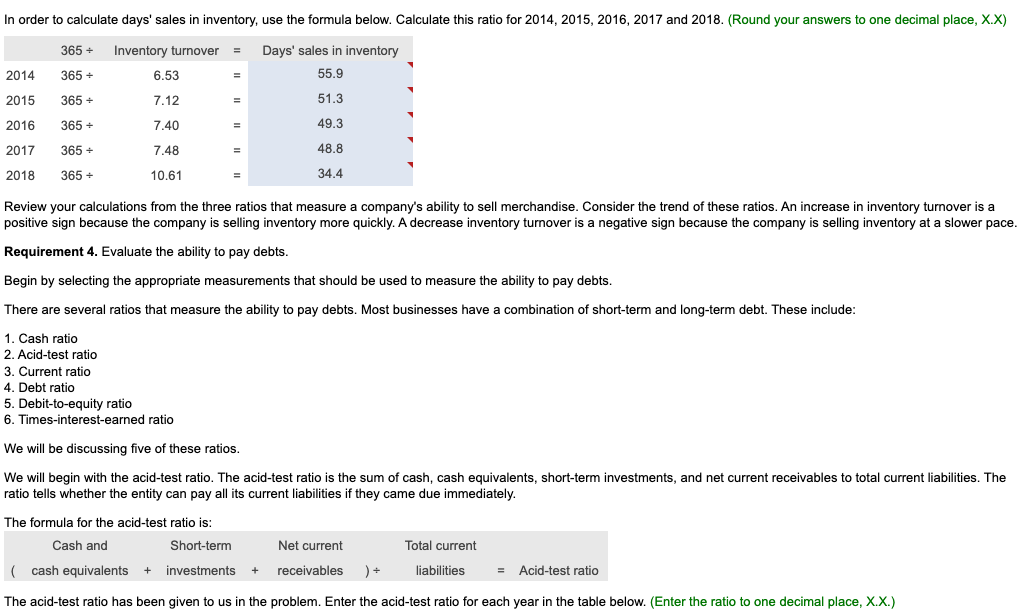
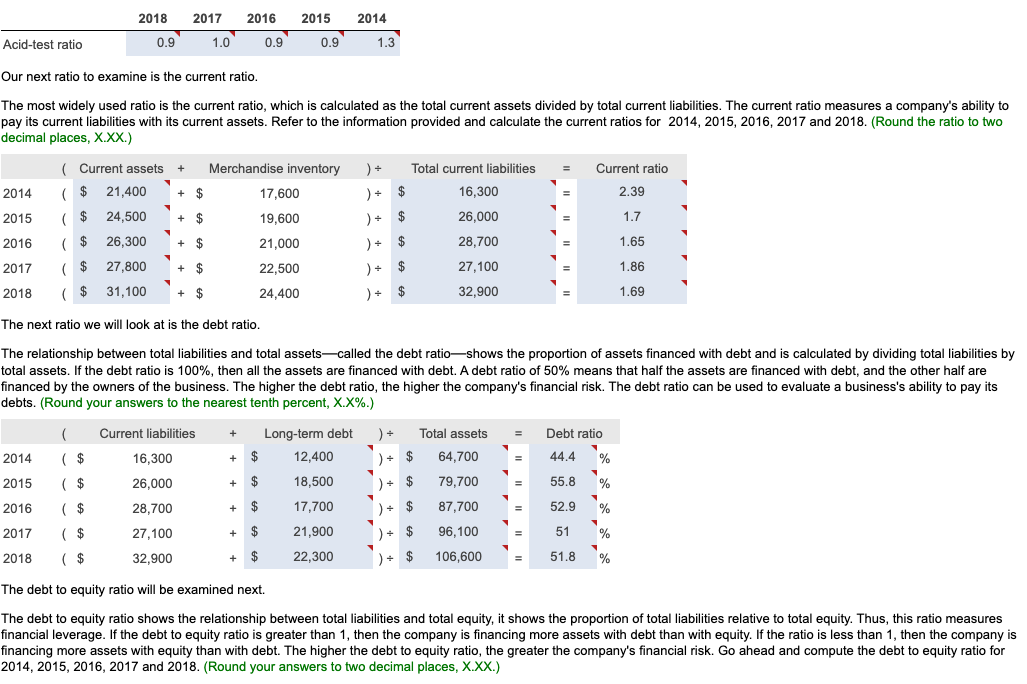
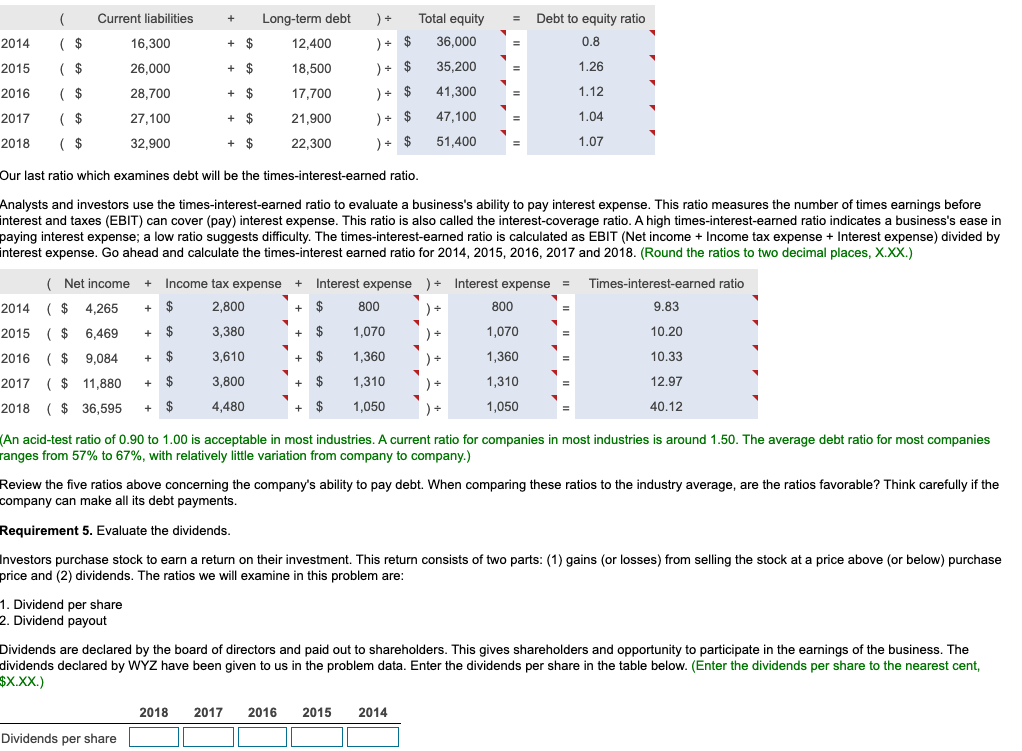
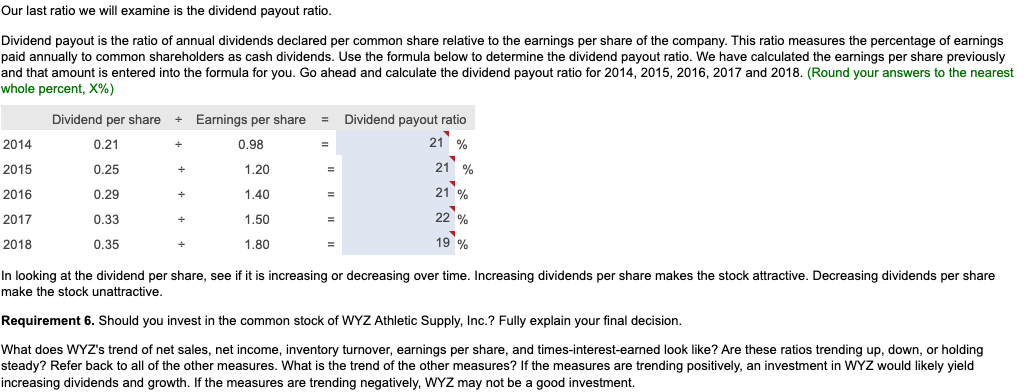
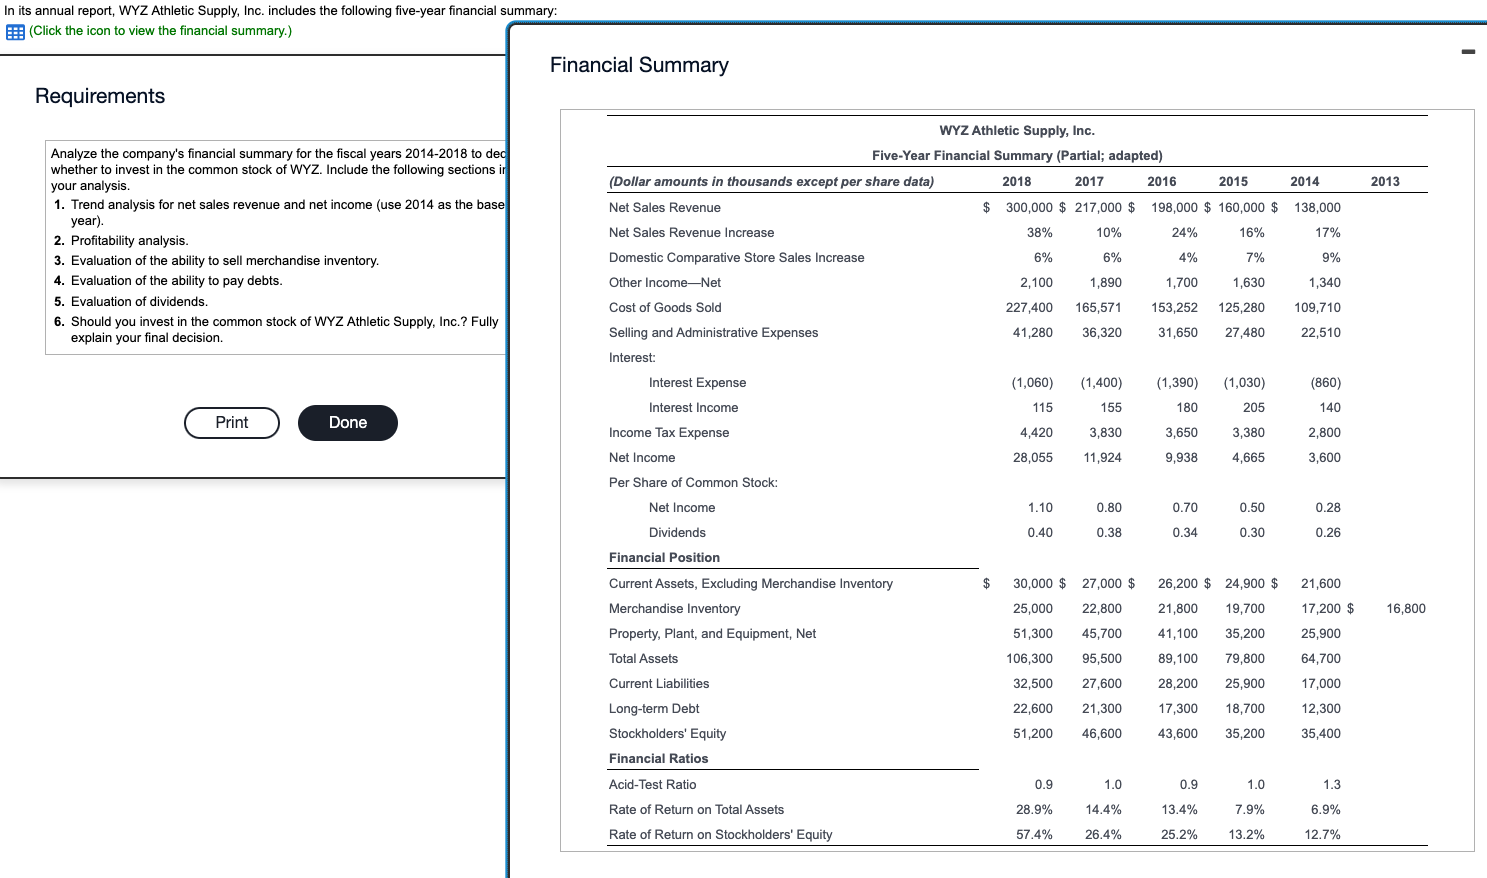
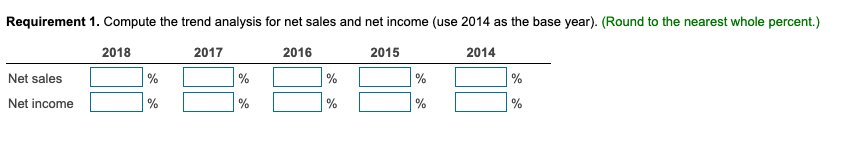
In its annual report, WYZ Athletic Supply, Inc. includes the following five-year financial summary: Financial Summary Requirement 1. Compute the trend analysis for net sales and net income (use 2014 as the base year). (Round to the nearest whole percent.) Requirement 1. Compute the trend analysis for net sales and net income (use 2014 as the base year). Trend analysis is a form of horizontal analysis. Trend percentages indicate the direction a business is taking. How have sales changed over a five-year period? What trend does period, which is 2014 for WYZ Athletic Supply, Inc. The base period amounts are set equal to 100%. The amounts for each subsequent year are expressed as a percentage of the (Any period amount Base period amount) 100= Trend % Begin by calculating the trend analysis percentages for net sales. percentages for 2015, 2016, 2017 and 2018. (Round your answers to the nearest whole percent.) Now, we can make similar calculations to determine the trend percentages for net income. The base period amount (100%) is 2014 net income, $4,265. Refer to the inform provided and complete the table below to compute the net income trend percentages for 2015 through 2018 . (Round your answers to the nearest whole percent.) these elements is positive, while a downward trend is negative. The fundamental goal of business is to earn a profit. Ratios that measure profitability often are reported in the business press. The five ratios include: 1. Earnings per share of common stock 2. Profit margin ratio 3. Rate of return on total assets 4. Asset turnover ratio 5. Rate of return on common stockholders' equity In this problem, we will examine four of the profitability ratios. Let's begin with earnings per share. Earnings per share (EPS) is perhaps the most widely quoted of all financial statistics. EPS is the only ratio that must appear on the financial stare reports the amount of net income (loss) for each share of the company's outstanding common stock. Earnings per share is calculated as net income minus prefered dividends divided by the weighted average number of common shares outstanding. Preferred dividends are subtracted from net income because the preferred stockholders have the first claim to dividends. The computation for the weighted average number of common shares outstanding is covered in advanced accounting courses. The formula for calculating earnings per share is: $X.XX.) The second profitability ratio we will examine is the profit margin ratio. income a business earns on every $1.00 of sales. This ratio focuses on the profitability of a business and is calculated as net income divided by net rever the information provided and complete the tables below to compute the profit margin ratio for 2014,2015,2016,2017 and 2018 . The net income and net sales amounts that you used previously have been entered into the table for you. (Round the profit margin ratio to one decimal place, X.X%.) The third profitability ratio we will calculate is the rate of return on total assets. The rate of return on total assets measures a company's success in using assets to earn a profit. There are two ways that a company can finance its assets: - Debt-A company can borrow cash from creditors to purchase assets. Creditors earn interest on the money that is loaned. Rate of return on total assets is calculated by adding interest expense to net income and dividing by average total assets. Interest expense is added back to net income to determine the real return on the assets regardless of the corporation's financing choices (debt or equity). In summary, the formula is: )=Rateofreturnontotalassets The rate of return on total assets has been given to us in the question. Please enter those amounts in the table below. (Enter the amounts to one tenth of a percent, X.X%.) The final profitability ratio we will calculate is the rate of return on common stockholders' equity. This popular measure of profitability, the rate of return on common stockholders' equity, often shortened to return on equity, shows the relationship between net income available common stockholders and their average common equity invested in the company. The rate of return on common stockholders' equity shows how much income is earned for eacl $1 invested by the common shareholders. To compute this ratio, we first subtract preferred dividends from net income to get neters. Then we divide net income available to common stockholders by average common stockholders' equity during the year. To summarize, the formula for on stockholders' equity is: The rate of return on common stockholders' equity has been given to us in the question. Please enter those amounts in the table below. (Enter the amounts to one tenth of a percent, X.X%.) Refer to the four profitability ratios that you calculated above. Is the trend in these ratios increasing or decreasing for the five years under examination? An increasing trend in these profitability ratios makes the stock attractive. A decreasing trend makes the stock unattractive. Requirement 3. Evaluate the ability to sell merchandise inventory. There are five ratios that measure a company's ability to sell merchandise: 1. Gross profit percentage 2. Inventory turnover 3. Days' sales in inventory 4. Accounts receivable turnover 5. Days' sales in receivables We will examine three of these ratios more closely below. Let's begin with gross profit percentage. Merchandisers strive to increase the gross profit percentage (also called the gross margin percentage). This ratio measures the profitability of each net sales do the of goods sold and is computed as gross profit divided by net sales revenue. We must first determine gross profit. Recall that gross profit is Net sales - Cost of goods sold. Use the table below to determine the gross profit for 2014,2015,2016,2017 and 2018 . The net sales amounts that you have used previously have been entered into the table for you. Now that we have determined the gross profit in each year, we can go ahead and calculate the gross profit percentage. Refer to the information provided and complete the tables below to compute the gross profit percentage for 2014,2015,2016,2017 and 2018 . The gross profit amount that you calculated above, and net sales amounts that you used previously, have been entered into the table for you. (Round the gross profit percentage to one the nearest tenth percent, X.X%.) Our next ratio to examine is inventory turnover. The inventory turnover ratio measures the number of times a company sells its average level of merchandise inventory during a year. A high rate of turnover indicates ease in selling merchandise inventory; a low rate indicates difficulty. A value of 4 means that the company sold its average level of merchandise inventory four times-once every three months-during the year. If the company were a seasonal company, this would be a good ratio because it would mean it turned its inventory over each season, on average. To compute inventory turnover, we divide cost of goods sold by the average merchandise inventory for the period. Be complete the ratio calculation, let's determine the average merchandise inventory for each year. (Round your answers to the nearest whole dollar.) complete the tables below to compute the inventory turnover for 2014, 2015, 2016, 2017 and 2018 . The average merchandise inventory that you calculat above has been entered into the table for you. (Round your final answers to two decimal places, X.XX.) The third ratio we will examine is the days' sales in inventory. This measures the average number of days merchandise inventory is held by the company. Days' sales inventory varies widely, depending on the business. An increasing trend is a negative sign, since inventory is not being sold as quickly, or too much inventory is being held in storage. A decreasing trend is a good indicator, since inventory is being sold more quickly, or less inventory is being held in storage. But, a business must watch that stock-outs do not occu Review your calculations from the three ratios that measure a company's ability to sell merchandise. Consider the trend of these ratios. An increase in inventory turnover is a Requirement 4. Evaluate the ability to pay debts. Begin by selecting the appropriate measurements that should be used to measure the ability to pay debts. There are several ratios that measure the ability to pay debts. Most businesses have a combination of short-term and longerm the in 1. Cash ratio 2. Acid-test ratio 3. Current ratio 4. Debt ratio 5. Debit-to-equity ratio 6. Times-interest-earned ratio We will be discussing five of these ratios. ratio tells whether the entity can pay all its current liabilities if they came due immediately. The most widely used ratio is the current ratio, which is calculated as the total current assets divided by total current liabilities. The current ratio measures a company's ability to pay its current liabilities with its current assets. Refer to the information provided and calculate the current ratios for 2014, 2015, 2016, 2017 and 2018 . (Round the ratio to two decimal places, X.XX.) The next ratio we will look at is the debt ratio. total assets. If the debt ratio is 100%, then all the assets are financed with debt. A debt ratio of 50% means that half the assets are financed with debt, and the other half are financed by the owners of the business. The higher the debt ratio, the higher the company's financial risk. The debt ratio can be used to evaluate a business's ability to pay its debts. (Round your answers to the nearest tenth percent, X.X\%.) The debt to equity ratio will be examined next. The debt to equity ratio shows the relationship between total liabilities and total equity, it shows the proportion of total liabilities relative to total equity. Thus, this ratio measures financial leverage. If the debt to equity ratio is greater than 1, then the company is financing more assets with debt than with equity. If the ratio is less than 1 , the the company is financing more assets with equity than with debt. The higher the debt to equity ratio, the greater the company's financial risk. Go ahead and compute the debt to equity ratio for 2014, 2015, 2016, 2017 and 2018. (Round your answers to two decimal places, X.XX.) Our last ratio which examines debt will be the times-interest-earned ratio. Analysts and investors use the times-interest-earned ratio to evaluate a business's ability to pay interest expense. This ratio measures the number times earnings before interest and taxes (EBIT) can cover (pay) interest expense. This ratio is also called the interest-coverage ratio. A high times-interest-earned ratio indicates a business's ease in paying interest expense; a low ratio suggests difficulty. The times-interest-earned ratio is calculated as EBIT (Net income + Income tax expense + Interest expense) divided by interest expense. Go ahead and calculate the times-interest earned ratio for 2014, 2015, 2016, 2017 and 2018. (Round the ratios to two decimal places, X.XX.) (An acid-test ratio of 0.90 to 1.00 is acceptable in most industries. A current ratio for companies in most industries is around 1.50. The average debt ratio for most companies ranges from 57% to 67%, with relatively little variation from company to company.) Review the five ratios above concerning the company's ability to pay debt. When comparing these ratios to the industry average, are the ratios favorable if the company can make all its debt payments. Requirement 5. Evaluate the dividends. Investors purchase stock to earn a return on their investment. This return consists of two parts: (1) gains (or losses) from selling the stock at a price above (or below) purchase price and (2) dividends. The ratios we will examine in this problem are: 1. Dividend per share 2. Dividend payout Dividends are declared by the board of directors and paid out to shareholders. This gives shareholders and opportunity to participate in the earnings of the business. The dividends declared by WYZ have been given to us in the problem data. Enter the dividends per share in the table below. (Enter the dividends per share to the nearest cent, $X.XX.) Our last ratio we will examine is the dividend payout ratio. paid annually to common shareholders as cash dividends. Use the formula below to determine the dividend payout ratio. We have calculated the earnings per share previously and that amount is entered into the formula for you. Go ahead and calculate the dividend payout ratio for 2014, 2015, 2016, 2017 and 2018. (Round your answers to the nearest whole percent, X% In looking at the dividend per share, see if it is increasing or decreasing over time. Increasing dividends per share makes the stock attractive. Decreasing dividends per share make the stock unattractive. Requirement 6. Should you invest in the common stock of WYZ Athletic Supply, Inc.? Fully explain your final decision. What does WYZ's trend of net sales, net income, inventory turnover, earnings per share, and times-interest-earned look like? Are these ratios trending up, down, or holding steady? Refer back to all of the other measures. What is the trend of the other measures? If the measures are trending positively, an investment in WYZ would likely yield ncreasing dividends and growth. If the measures are trending negatively, WYZ may not be a good investment
Step by Step Solution
There are 3 Steps involved in it

Get step-by-step solutions from verified subject matter experts