

Question: these are the ratios you will need to use answer question 4 using the information provided and the ratios from table 4.1, the 2nd picture.
these are the ratios you will need to use
answer question 4 using the information provided and the ratios from table 4.1, the 2nd picture. thank you.
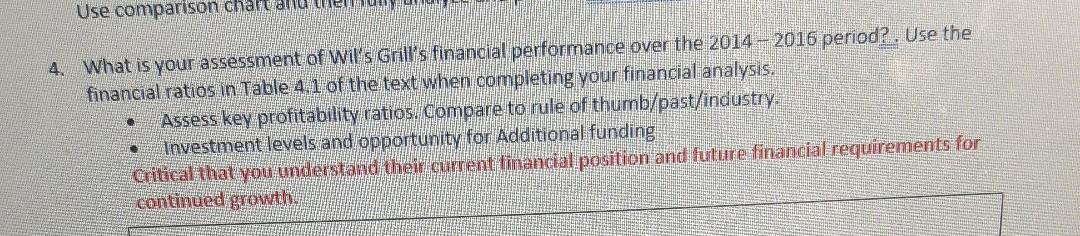
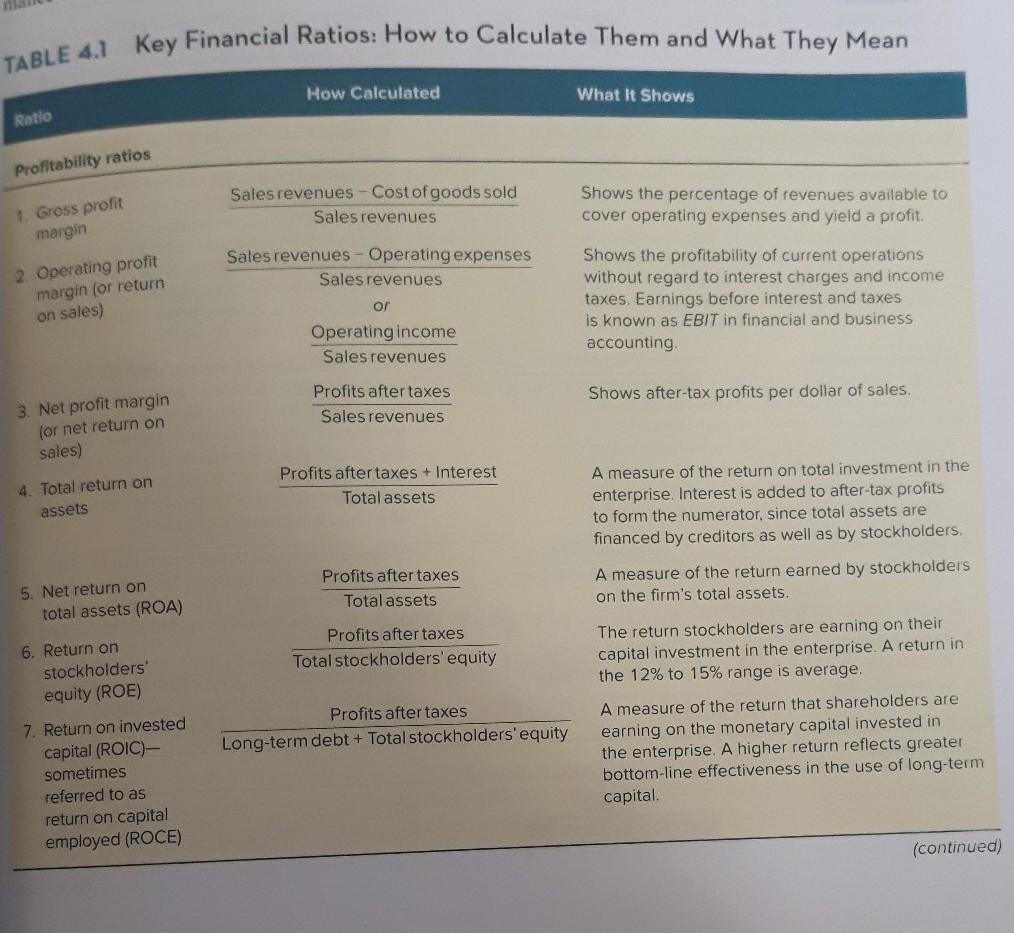
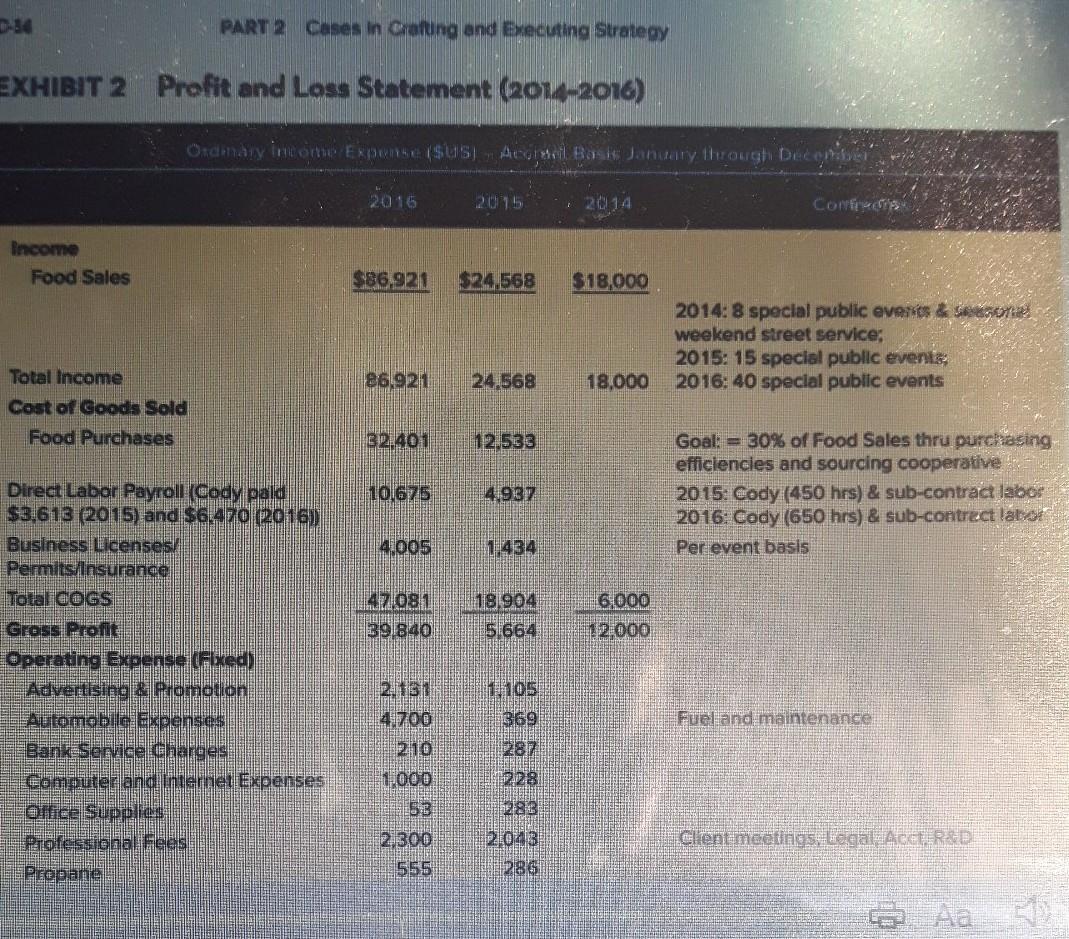
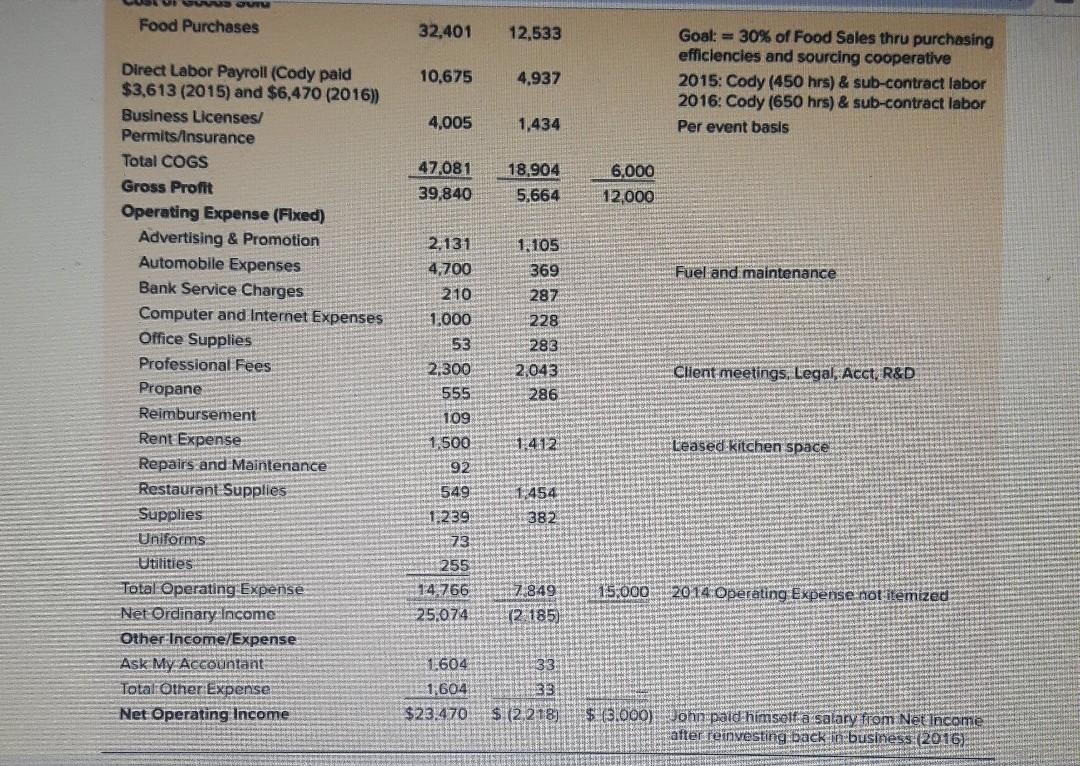
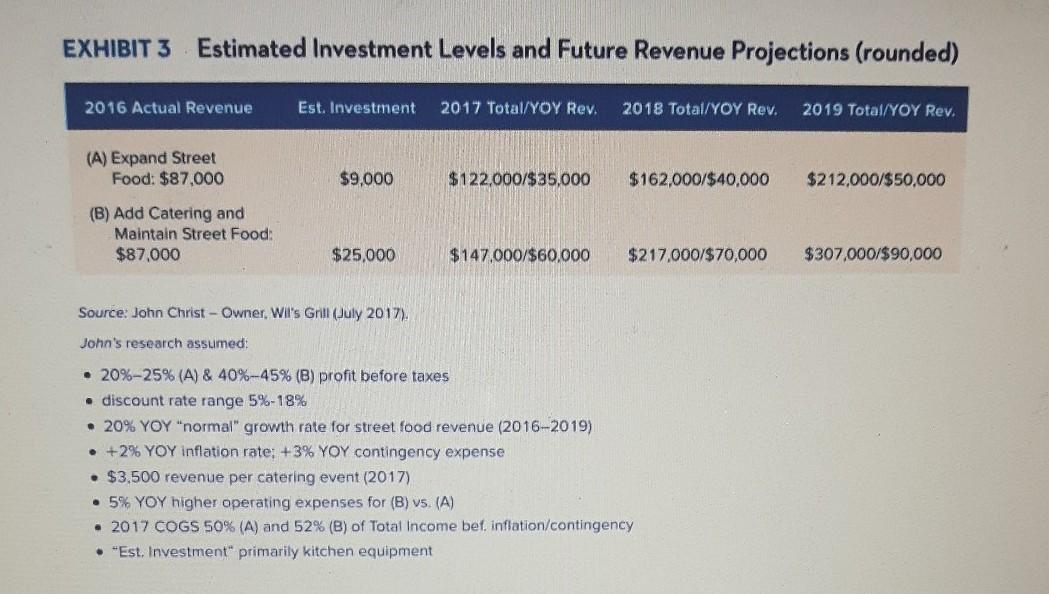
Use comparison chant au mer 4 What is your assessment of Wil's Grill's financial performance over the 2014 - 2016 period?. Use the financial ratios in Table 4.1 of the text when completing your financial analysis. Assess key profitability ratios. Compare to rule of thumb/past/industry. Investment levels and opportunity for Additional funding Critical that you understand their current financial position and future financial requirements for continued growth TABLE 4.1 Key Financial Ratios: How to Calculate them and What They Mean How Calculated What It Shows Ratio Profitability ratios Sales revenues - Cost of goods sold Sales revenues Shows the percentage of revenues available to cover operating expenses and yield a profit. 1. Gross profit margin Sales revenues - Operating expenses Sales revenues 2. Operating profit margin (or return on sales) Shows the profitability of current operations without regard to interest charges and income taxes. Earnings before interest and taxes is known as EBIT in financial and business accounting or Operating income Sales revenues Shows after-tax profits per dollar of sales. Profits after taxes Sales revenues 3. Net profit margin (or net return on sales) 4. Total return on assets Profits after taxes + Interest Total assets A measure of the return on total investment in the enterprise. Interest is added to after-tax profits to form the numerator, since total assets are financed by creditors as well as by stockholders. Profits after taxes Total assets A measure of the return earned by stockholders on the firm's total assets. 5. Net return on total assets (ROA) Profits after taxes Total stockholders' equity 6. Return on stockholders' equity (ROE) 7. Return on invested capital (ROIC)- sometimes referred to as return on capital employed (ROCE) Profits after taxes Long-term debt + Total stockholders' equity The return stockholders are earning on their capital investment in the enterprise. A return in the 12% to 15% range is average. A measure of the return that shareholders are earning on the monetary capital invested in the enterprise. A higher return reflects greater bottom-line effectiveness in the use of long-term capital (continued) PART 2 cases in Crafung and executing Strategy EXHIBIT 2 Profit and Loss Statement (2014-2016) Ordinary income ERP ($USY A Bos January through Dec 2016 2014 Correo Income Food Sales $86.92 $24.568 $18,000 2014: 8 special public events & Second weekend street service: 2015: 15 special public events 2016: 40 special public events 86.921 24.568 18,000 Total Income Cost of Goods Sold Food Purchases 32.401 12.533 101.675 14.937 Goal: = 30% of Food Sales thru purchasing efficiencies and sourcing cooperative 2015: Cody (450 hrs) & sub-contract labor 2016: Cody (650 hrs) & sub-contract latus Per event basis 14.005 1434 19.904 471081 39 1840 6.000 12.000 5.664 Dired Labor Payroll (Cody pald $3.618 (2015) and $6.470 2016) Business Licenses! Permits Insurance, Total COGS Gross Profit Operating Expense (Fixed) Advertising & Promotion Automobile Expensio Bankeservice charges Gomputer and internet Expenses Office Supplies Professional Fees Propane 2131 41700 210 Fuel and malntenance 1105 369 1287 1228 1000 53 283 2,300 Clent meetings, Regal ACEERD 2043 286 555 Food Purchases 32,401 12,533 10,675 4,937 Goal: = 30% of Food Sales thru purchasing efficiencies and sourcing cooperative 2015: Cody (450 hrs) & sub-contract labor 2016: Cody (650 hrs) & sub-contract labor Per event basis 4,005 1,434 47,081 39,840 18.904 5,664 6,000 12,000 Fuel and maintenance Direct Labor Payroll (Cody paid $3,613 (2015) and $6,470 (2016)) Business Licenses/ Permits/Insurance Total COGS Gross Profit Operating Expense (Fixed) Advertising & Promotion Automobile Expenses Bank Service Charges Computer and Internet Expenses Office Supplies Professional Fees Propane Reimbursement Rent Expense Repairs and Maintenance Restaurant Supplies Supplies Uniforms Utitities Total Operating Expense Net Ordinary Income Other Income/Expense Ask My Accountant Total Other Expense Net Operating Income 2.131 4,700 210 1,000 53 2,300 555 109 1.105 369 287 228 283 2,043 286 Client meetings, Legal, Acct R&D 1412 1,500 92 Leased kitchen space 549 1.454 382 1.239 73 255 15.000 14.766 -25.074 7,849 12.185) 2014 Operating Expense not-itemized 1604 1,604 $23.470 33 33 $ (2218) $ (31000) John paid himself a salary from Net Income after reinvesting back to business (2016) EXHIBIT 3 Estimated Investment Levels and Future Revenue Projections (rounded) 2016 Actual Revenue Est. Investment 2017 Total/YOY Rev. 2018 Total/YOY Rev. 2019 Total/YOY Rev. (A) Expand Street Food: $87,000 $9,000 $122,000/$35,000 $162,000/$40,000 $212,000/$50,000 (B) Add Catering and Maintain Street Food: $87,000 $25,000 $147.000/$60,000 $217,000/$70,000 $307,000/$90,000 Source: John Christ - Owner, Wil's Grill (July 2017) John's research assumed: 20%-25% (A) & 40%-45% (B) profit before taxes discount rate range 5%-18% 20% YOY"normal" growth rate for street food revenue (2016-2019) +2% YOY inflation rate: +3% YOY contingency expense $3,500 revenue per catering event (2017) 5% YOY higher operating expenses for (B) vs. (A) 2017 COGS 50% (A) and 52% (B) of Total Income bef. inflation/contingency "Est. Investment primarily kitchen equipment Use comparison chant au mer 4 What is your assessment of Wil's Grill's financial performance over the 2014 - 2016 period?. Use the financial ratios in Table 4.1 of the text when completing your financial analysis. Assess key profitability ratios. Compare to rule of thumb/past/industry. Investment levels and opportunity for Additional funding Critical that you understand their current financial position and future financial requirements for continued growth TABLE 4.1 Key Financial Ratios: How to Calculate them and What They Mean How Calculated What It Shows Ratio Profitability ratios Sales revenues - Cost of goods sold Sales revenues Shows the percentage of revenues available to cover operating expenses and yield a profit. 1. Gross profit margin Sales revenues - Operating expenses Sales revenues 2. Operating profit margin (or return on sales) Shows the profitability of current operations without regard to interest charges and income taxes. Earnings before interest and taxes is known as EBIT in financial and business accounting or Operating income Sales revenues Shows after-tax profits per dollar of sales. Profits after taxes Sales revenues 3. Net profit margin (or net return on sales) 4. Total return on assets Profits after taxes + Interest Total assets A measure of the return on total investment in the enterprise. Interest is added to after-tax profits to form the numerator, since total assets are financed by creditors as well as by stockholders. Profits after taxes Total assets A measure of the return earned by stockholders on the firm's total assets. 5. Net return on total assets (ROA) Profits after taxes Total stockholders' equity 6. Return on stockholders' equity (ROE) 7. Return on invested capital (ROIC)- sometimes referred to as return on capital employed (ROCE) Profits after taxes Long-term debt + Total stockholders' equity The return stockholders are earning on their capital investment in the enterprise. A return in the 12% to 15% range is average. A measure of the return that shareholders are earning on the monetary capital invested in the enterprise. A higher return reflects greater bottom-line effectiveness in the use of long-term capital (continued) PART 2 cases in Crafung and executing Strategy EXHIBIT 2 Profit and Loss Statement (2014-2016) Ordinary income ERP ($USY A Bos January through Dec 2016 2014 Correo Income Food Sales $86.92 $24.568 $18,000 2014: 8 special public events & Second weekend street service: 2015: 15 special public events 2016: 40 special public events 86.921 24.568 18,000 Total Income Cost of Goods Sold Food Purchases 32.401 12.533 101.675 14.937 Goal: = 30% of Food Sales thru purchasing efficiencies and sourcing cooperative 2015: Cody (450 hrs) & sub-contract labor 2016: Cody (650 hrs) & sub-contract latus Per event basis 14.005 1434 19.904 471081 39 1840 6.000 12.000 5.664 Dired Labor Payroll (Cody pald $3.618 (2015) and $6.470 2016) Business Licenses! Permits Insurance, Total COGS Gross Profit Operating Expense (Fixed) Advertising & Promotion Automobile Expensio Bankeservice charges Gomputer and internet Expenses Office Supplies Professional Fees Propane 2131 41700 210 Fuel and malntenance 1105 369 1287 1228 1000 53 283 2,300 Clent meetings, Regal ACEERD 2043 286 555 Food Purchases 32,401 12,533 10,675 4,937 Goal: = 30% of Food Sales thru purchasing efficiencies and sourcing cooperative 2015: Cody (450 hrs) & sub-contract labor 2016: Cody (650 hrs) & sub-contract labor Per event basis 4,005 1,434 47,081 39,840 18.904 5,664 6,000 12,000 Fuel and maintenance Direct Labor Payroll (Cody paid $3,613 (2015) and $6,470 (2016)) Business Licenses/ Permits/Insurance Total COGS Gross Profit Operating Expense (Fixed) Advertising & Promotion Automobile Expenses Bank Service Charges Computer and Internet Expenses Office Supplies Professional Fees Propane Reimbursement Rent Expense Repairs and Maintenance Restaurant Supplies Supplies Uniforms Utitities Total Operating Expense Net Ordinary Income Other Income/Expense Ask My Accountant Total Other Expense Net Operating Income 2.131 4,700 210 1,000 53 2,300 555 109 1.105 369 287 228 283 2,043 286 Client meetings, Legal, Acct R&D 1412 1,500 92 Leased kitchen space 549 1.454 382 1.239 73 255 15.000 14.766 -25.074 7,849 12.185) 2014 Operating Expense not-itemized 1604 1,604 $23.470 33 33 $ (2218) $ (31000) John paid himself a salary from Net Income after reinvesting back to business (2016) EXHIBIT 3 Estimated Investment Levels and Future Revenue Projections (rounded) 2016 Actual Revenue Est. Investment 2017 Total/YOY Rev. 2018 Total/YOY Rev. 2019 Total/YOY Rev. (A) Expand Street Food: $87,000 $9,000 $122,000/$35,000 $162,000/$40,000 $212,000/$50,000 (B) Add Catering and Maintain Street Food: $87,000 $25,000 $147.000/$60,000 $217,000/$70,000 $307,000/$90,000 Source: John Christ - Owner, Wil's Grill (July 2017) John's research assumed: 20%-25% (A) & 40%-45% (B) profit before taxes discount rate range 5%-18% 20% YOY"normal" growth rate for street food revenue (2016-2019) +2% YOY inflation rate: +3% YOY contingency expense $3,500 revenue per catering event (2017) 5% YOY higher operating expenses for (B) vs. (A) 2017 COGS 50% (A) and 52% (B) of Total Income bef. inflation/contingency "Est. Investment primarily kitchen equipment
Step by Step Solution
There are 3 Steps involved in it

Get step-by-step solutions from verified subject matter experts