

Question: these below are solved examples These below need to be solved This is the only direction left with the assignment The attached workbook demonstrates the

these below are solved examples
These below need to be solved
This is the only direction left with the assignment
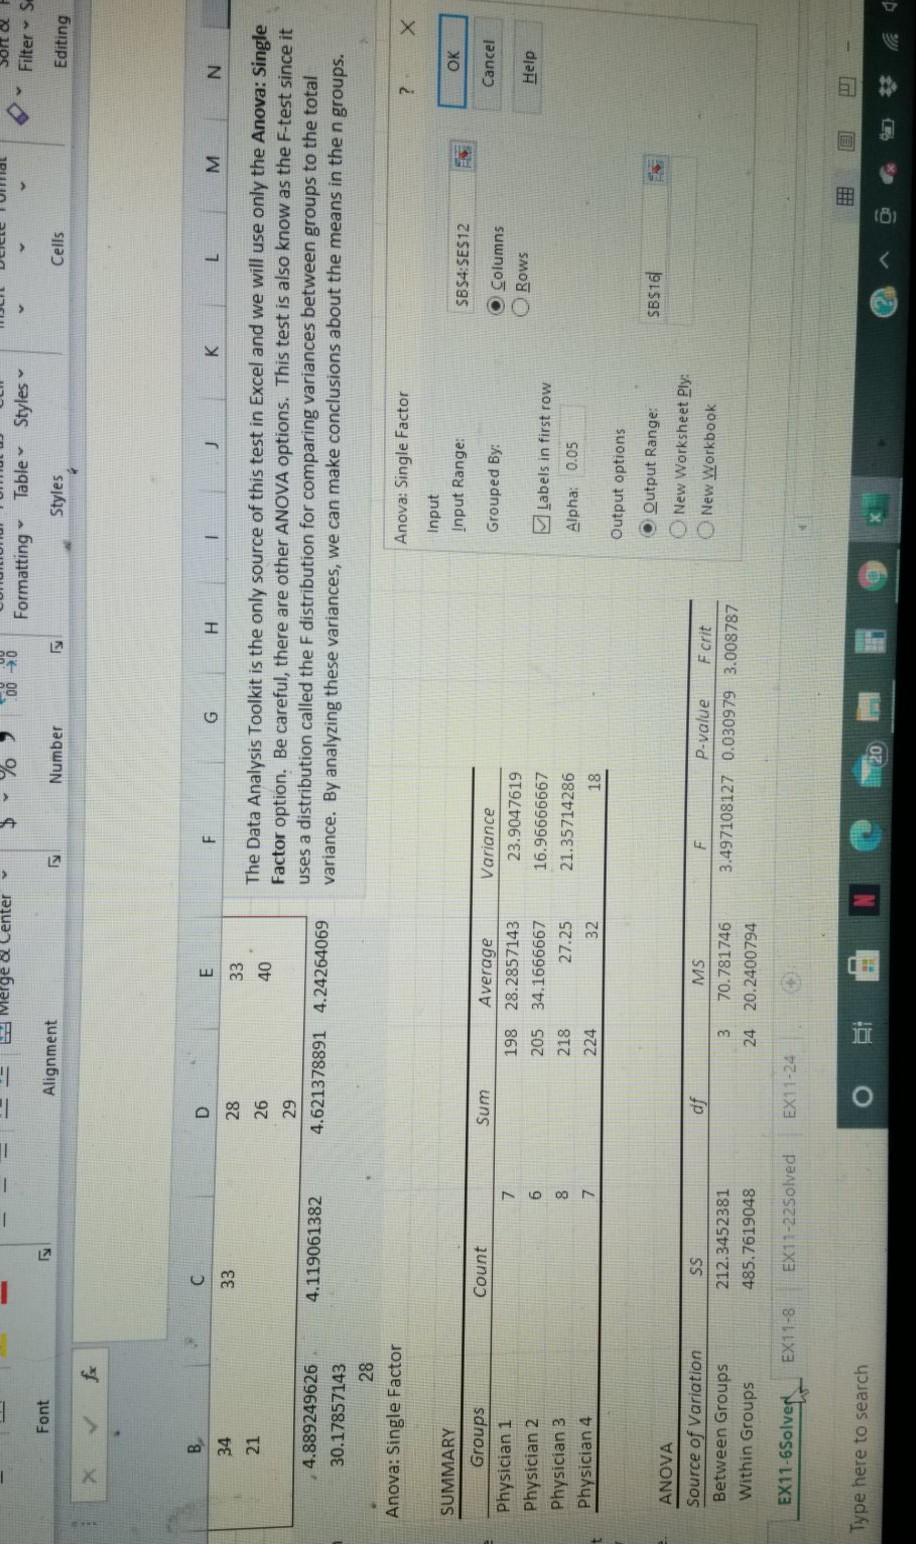
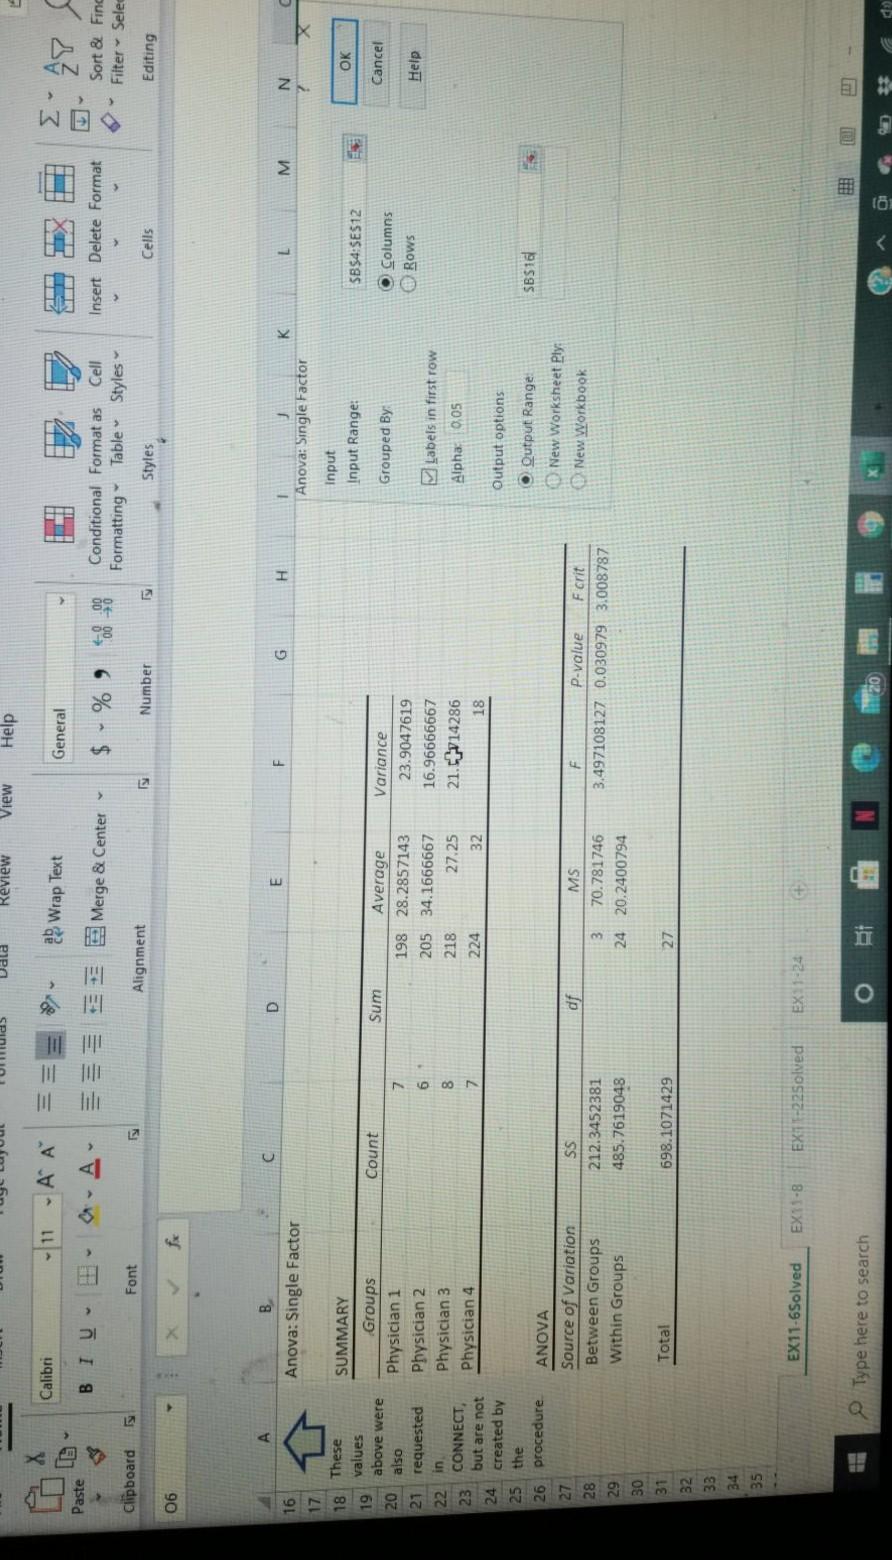
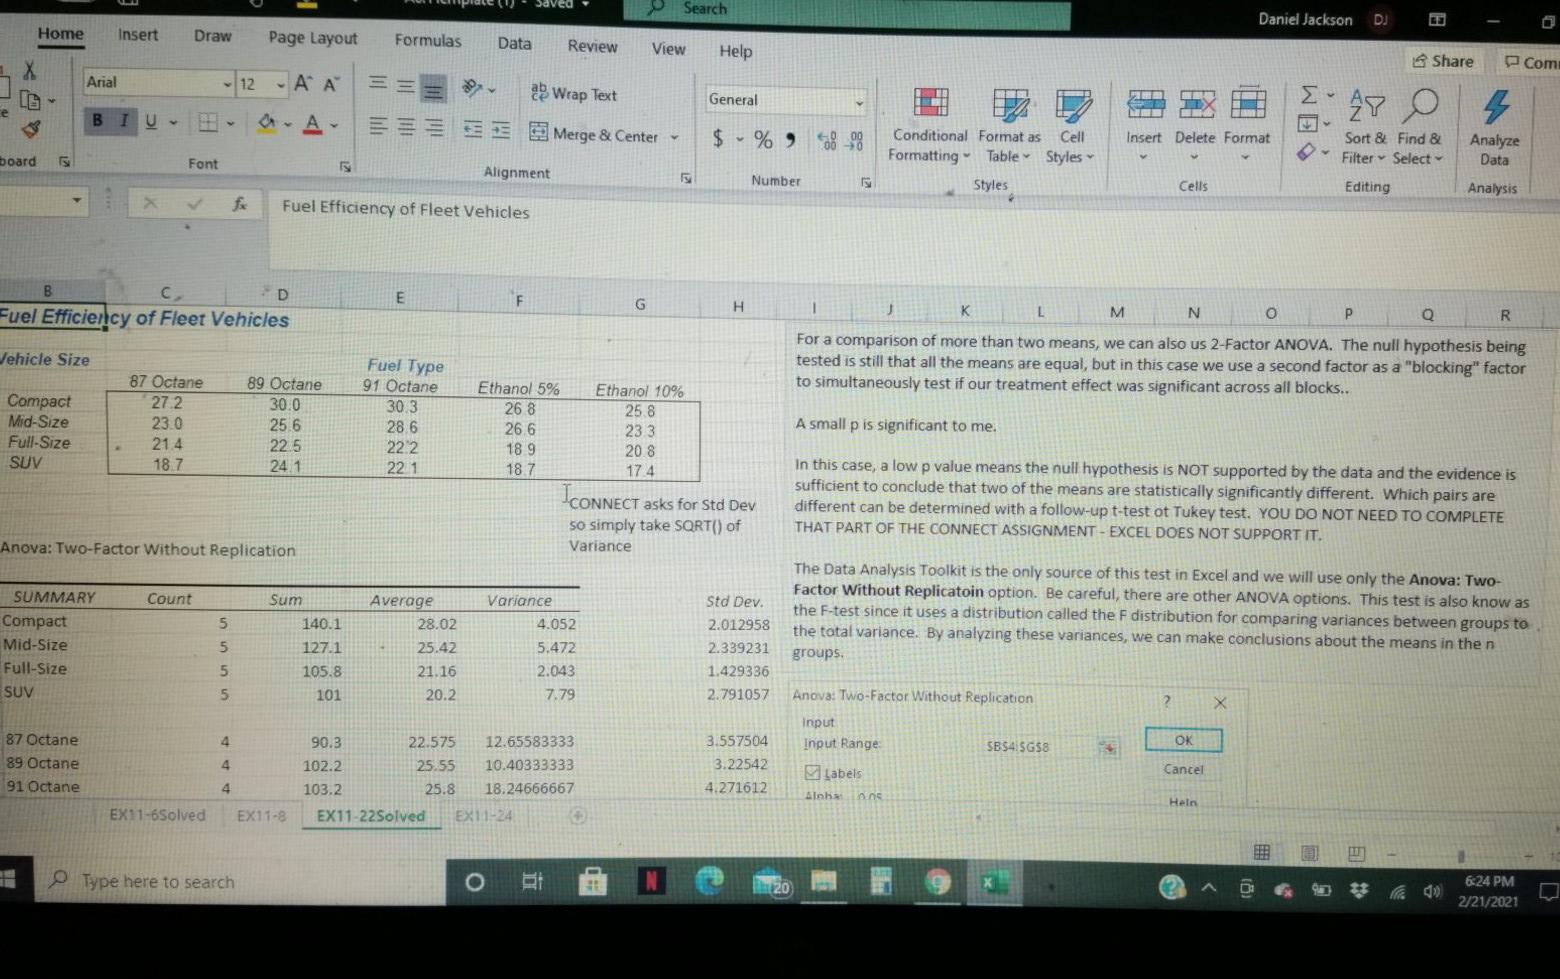
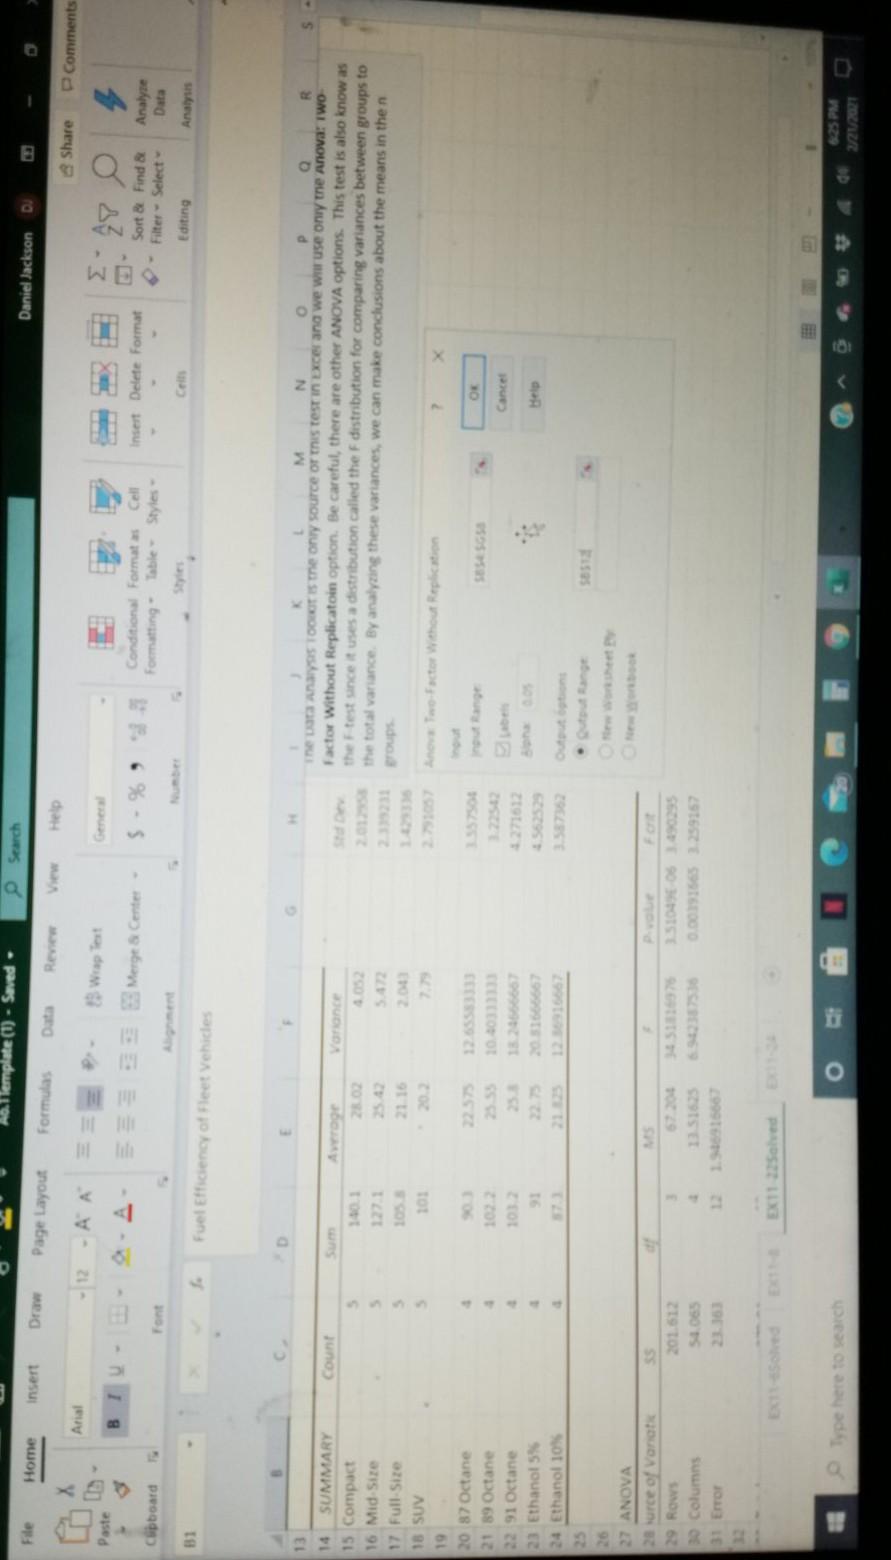
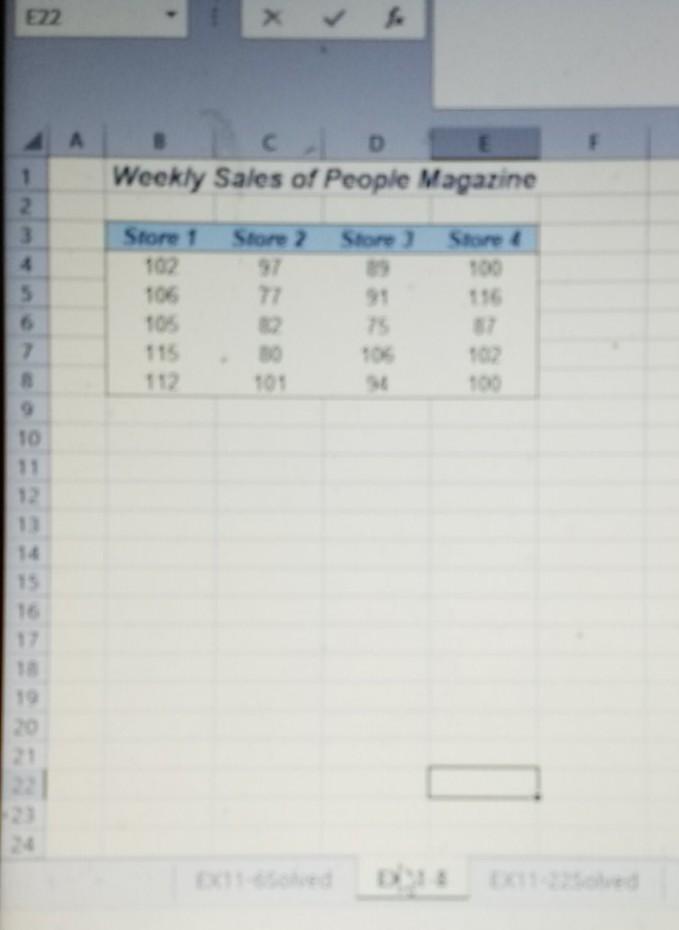
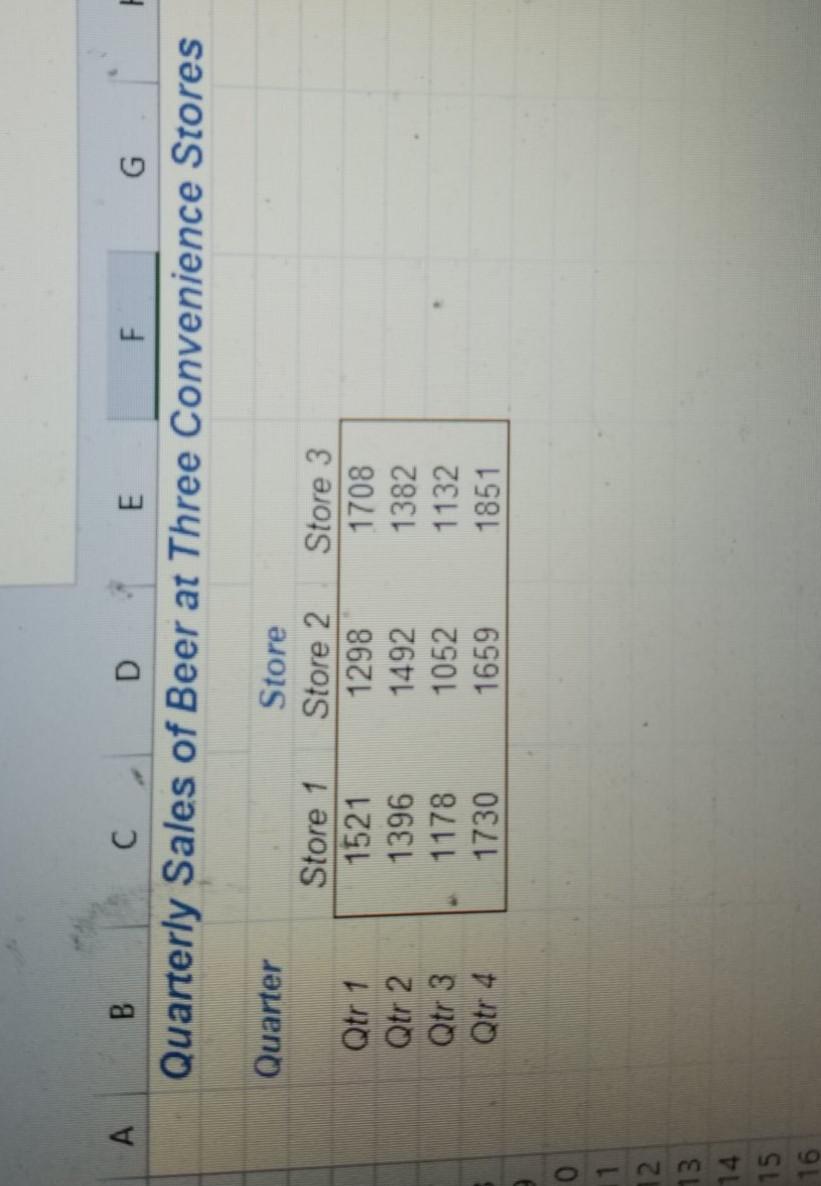
The attached workbook demonstrates the use of the Excel Data Analysis Toolkit for Single Factor and Two Factor Analysis. Two solved examples are provided for you and two unsolved CONNECT exercises are required to be completed. Use this workbook to help complete Chapter 11 Homework. Week 6: Resource for ANOVA Assignments Note that this is not a "template" as was provided in Week 5. You need only use the Data Analysis Toolkit to generate the majority of the requested output. The remainder can be done with Excel formulas. Previous Next > search o 20 - - Merge & Center 000 Formatting Table Styles Filters Font Alignment Number Styles Cells Editing . D E F G H 1 J K L M N 34 33 28 33 21 26 40 The Data Analysis Toolkit is the only source of this test in Excel and we will use only the Anova: Single Factor option. Be careful, there are other ANOVA options. This test is also know as the F-test since it uses a distribution called the F distribution for comparing variances between groups to the total variance. By analyzing these variances, we can make conclusions about the means in the n groups. 4.119061382 29 4.621378891 4.24264069 4.889249626 30.17857143 28 Anova: Single Factor ? X Anova: Single Factor Input Input Range: OK SB$4:SES12 Count Sum Grouped By: Cancel 7 SUMMARY Groups Physician 1 Physician 2 Physician 3 Physician 4 o Columns Rows 6 Average 198 28.2857143 205 34.1666667 27.25 224 32 Help Variance 23.9047619 16.96666667 21.35714286 18 Labels in first row 8 218 Alpha: 0.05 7 Output options SB$16 O Output Range: New Worksheet Ply: New Workbook ANOVA Source of Variation Between Groups Within Groups df SS 212.3452381 485.7619048 MS 3 70.781746 24 20.2400794 P-value F crit 3.497108127 0.030979 3.008787 EX11-6Solve EX11-8 EX11-22Solved EX11-24 FEE Type here to search i Review View Help X Calibri - 11 A A 2 Wrap Text General w 27 Paste BIU- Merge & Center $ % 90 Insert Delete Format Conditional Format as Cell Formatting Table Styles Styles Sort & Find Filter - Selec Clipboard Font Alignment Number Cells Editing 06 fx A D B Anova: Single Factor E F G H 16 K L M N 1 Anova: Single Factor X 17 18 These SUMMARY Input Input Range: OK $B$4:$E$12 Count Sum Cancel Grouped By 7 Groups Physician 1 Physician 2 Physician 3 Physician 4 O Columns Rows Help 6 Average 198 28.2857143 205 34.1666667 218 27.25 224 32 values 19 above were 20 also 21 requested 22 in 23 CONNECT, but are not 24 created by 25 the 26 procedure 27 28 Variance 23.9047619 16.96666667 21.-4714286 18 Labels in first row 8 Alpha 0.05 7 Output options O Output Range: SBS1 df ANOVA Source of Variation Between Groups Within Groups New Worksheet Ply: New Workbook SS 212.3452381 485.7619048 F P-value F crit 3.497108127 0.030979 3.008787 MS 3 70.781746 24 20.2400794 29 30 31 Total 698.1071429 27 32 33 35 EX11-6Solved EX11-8 EX1-22Solved EX 1-24 + Type here to search Search Daniel Jackson DJ Home Insert Draw Page Layout Formulas Data Review View Help Share Com j Arial - 12 - A A 2 Wrap Text General 27 0 ce 2 BIU WS Merge & Center $ % 938_98 Insert Delete Format Conditional Format as Cell Formatting Table Styles Sort & Find & Filter Select Analyze Data board Font Alignment Number Styles Cells Editing Analysis Fuel Efficiency of Fleet Vehicles E F B Fuel Efficiency of Fleet Vehicles G H Jehicle Size K M N o P R For a comparison of more than two means, we can also us 2-Factor ANOVA. The null hypothesis being tested is still that all the means are equal, but in this case we use a second factor as a "blocking" factor to simultaneously test if our treatment effect was significant across all blocks.. Fuel Type 91 Octane Compact Mid-Size Full-Size SUV 87 Octane 272 23.0 21.4 18.7 89 Octane 30.0 25.6 22.5 24.1 A small p is significant to me. 30.3 28.6 222 221 Ethanol 5% Ethanol 10% 26 8 25.8 26 6 23 3 18.9 20.8 18.7 17.4 CONNECT asks for Std Dev so simply take SQRT() of Variance In this case, a low p value means the null hypothesis is NOT supported by the data and the evidence is sufficient to conclude that two of the means are statistically significantly different. Which pairs are different can be determined with a follow-up t-test ot Tukey test. YOU DO NOT NEED TO COMPLETE THAT PART OF THE CONNECT ASSIGNMENT - EXCEL DOES NOT SUPPORT IT. Anova: Two-Factor Without Replication Count Sum 5 SUMMARY Compact Mid-Size Full Size SUV 140.1 The Data Analysis Toolkit is the only source of this test in Excel and we will use only the Anova: Two- Factor Without Replicatoin option. Be careful, there are other ANOVA options. This test is also know as the F-test since it uses a distribution called the F distribution for comparing variances between groups to the total variance. By analyzing these variances, we can make conclusions about the means in the n groups 5 5 Average 28.02 25.42 21.16 20.2 127.1 105.8 101 Variance 4.052 5.472 2.043 7.79 Std Dev. 2.012958 2.339231 1.429336 2.791057 5 4 87 Octane 89 Octane 91 Octane OK Anova: Two-Factor Without Replication Input Input Range $B$4:$G$8 Labels nns 4 90.3 22.575 12.65583333 102.2 25.55 10.40333333 103.2 25.8 18.24666667 EX11-22Solved EX11-24 3.557504 3.22542 4.271612 Cancel 4 Heln EX11-6Solved EX11-8 Type here to search 6:24 PM 2/21/2021 emplate() - Saved e Search File Home insert Daniel Jackson Draw Page Layout Formulas Data Review X Share Arial P Comments Paste Genel 28 B Merge & Center $ - % Conditional Formats Cell Formatting Table Styles Insert Delete Format Clipboard Sort & Find & Filter Select Font Analyze Data 31 Editing Analys . Fuel Efficiency of fleet vehicles D 13 Count Average M N P Q R The Data Analysis is the ony source of this test in Externa we wir use only the Anova: Two Factor Without Replicatoin option. Be careful, there are other ANOVA options. This test is also know as the test since it uses a distribution called the F distribution for comparing variances between groups to the total variance. By analyzing these variances, we can make conclusions about the means in then 5 5 3 12 105 2013 roups 20 > SUMMARY 15 Compact 16 Mid Site 17 Full Size 18 SUV 19 20 87 Octane 21 89 Octane 22 91 Octane 23 Ethanol 5% 24 Ethanol 10% 2 x utage OE Cancel 103 101 91 125667 tutt 27 ANOVA 20 urce of Varat 29 Rows 3 Columns Error 4.5 201512 54.06 2915529157 1351535 115663 EX11 225oved Type here to search o E22 X A D Weekly Sales of People Magazine 1 2 3 Store 2 Store Store Store 1 102 106 TO 115 112 91 2 101 TO 12 13 14 15 19 The attached workbook demonstrates the use of the Excel Data Analysis Toolkit for Single Factor and Two Factor Analysis. Two solved examples are provided for you and two unsolved CONNECT exercises are required to be completed. Use this workbook to help complete Chapter 11 Homework. Week 6: Resource for ANOVA Assignments Note that this is not a "template" as was provided in Week 5. You need only use the Data Analysis Toolkit to generate the majority of the requested output. The remainder can be done with Excel formulas. Previous Next > search o 20 - - Merge & Center 000 Formatting Table Styles Filters Font Alignment Number Styles Cells Editing . D E F G H 1 J K L M N 34 33 28 33 21 26 40 The Data Analysis Toolkit is the only source of this test in Excel and we will use only the Anova: Single Factor option. Be careful, there are other ANOVA options. This test is also know as the F-test since it uses a distribution called the F distribution for comparing variances between groups to the total variance. By analyzing these variances, we can make conclusions about the means in the n groups. 4.119061382 29 4.621378891 4.24264069 4.889249626 30.17857143 28 Anova: Single Factor ? X Anova: Single Factor Input Input Range: OK SB$4:SES12 Count Sum Grouped By: Cancel 7 SUMMARY Groups Physician 1 Physician 2 Physician 3 Physician 4 o Columns Rows 6 Average 198 28.2857143 205 34.1666667 27.25 224 32 Help Variance 23.9047619 16.96666667 21.35714286 18 Labels in first row 8 218 Alpha: 0.05 7 Output options SB$16 O Output Range: New Worksheet Ply: New Workbook ANOVA Source of Variation Between Groups Within Groups df SS 212.3452381 485.7619048 MS 3 70.781746 24 20.2400794 P-value F crit 3.497108127 0.030979 3.008787 EX11-6Solve EX11-8 EX11-22Solved EX11-24 FEE Type here to search i Review View Help X Calibri - 11 A A 2 Wrap Text General w 27 Paste BIU- Merge & Center $ % 90 Insert Delete Format Conditional Format as Cell Formatting Table Styles Styles Sort & Find Filter - Selec Clipboard Font Alignment Number Cells Editing 06 fx A D B Anova: Single Factor E F G H 16 K L M N 1 Anova: Single Factor X 17 18 These SUMMARY Input Input Range: OK $B$4:$E$12 Count Sum Cancel Grouped By 7 Groups Physician 1 Physician 2 Physician 3 Physician 4 O Columns Rows Help 6 Average 198 28.2857143 205 34.1666667 218 27.25 224 32 values 19 above were 20 also 21 requested 22 in 23 CONNECT, but are not 24 created by 25 the 26 procedure 27 28 Variance 23.9047619 16.96666667 21.-4714286 18 Labels in first row 8 Alpha 0.05 7 Output options O Output Range: SBS1 df ANOVA Source of Variation Between Groups Within Groups New Worksheet Ply: New Workbook SS 212.3452381 485.7619048 F P-value F crit 3.497108127 0.030979 3.008787 MS 3 70.781746 24 20.2400794 29 30 31 Total 698.1071429 27 32 33 35 EX11-6Solved EX11-8 EX1-22Solved EX 1-24 + Type here to search Search Daniel Jackson DJ Home Insert Draw Page Layout Formulas Data Review View Help Share Com j Arial - 12 - A A 2 Wrap Text General 27 0 ce 2 BIU WS Merge & Center $ % 938_98 Insert Delete Format Conditional Format as Cell Formatting Table Styles Sort & Find & Filter Select Analyze Data board Font Alignment Number Styles Cells Editing Analysis Fuel Efficiency of Fleet Vehicles E F B Fuel Efficiency of Fleet Vehicles G H Jehicle Size K M N o P R For a comparison of more than two means, we can also us 2-Factor ANOVA. The null hypothesis being tested is still that all the means are equal, but in this case we use a second factor as a "blocking" factor to simultaneously test if our treatment effect was significant across all blocks.. Fuel Type 91 Octane Compact Mid-Size Full-Size SUV 87 Octane 272 23.0 21.4 18.7 89 Octane 30.0 25.6 22.5 24.1 A small p is significant to me. 30.3 28.6 222 221 Ethanol 5% Ethanol 10% 26 8 25.8 26 6 23 3 18.9 20.8 18.7 17.4 CONNECT asks for Std Dev so simply take SQRT() of Variance In this case, a low p value means the null hypothesis is NOT supported by the data and the evidence is sufficient to conclude that two of the means are statistically significantly different. Which pairs are different can be determined with a follow-up t-test ot Tukey test. YOU DO NOT NEED TO COMPLETE THAT PART OF THE CONNECT ASSIGNMENT - EXCEL DOES NOT SUPPORT IT. Anova: Two-Factor Without Replication Count Sum 5 SUMMARY Compact Mid-Size Full Size SUV 140.1 The Data Analysis Toolkit is the only source of this test in Excel and we will use only the Anova: Two- Factor Without Replicatoin option. Be careful, there are other ANOVA options. This test is also know as the F-test since it uses a distribution called the F distribution for comparing variances between groups to the total variance. By analyzing these variances, we can make conclusions about the means in the n groups 5 5 Average 28.02 25.42 21.16 20.2 127.1 105.8 101 Variance 4.052 5.472 2.043 7.79 Std Dev. 2.012958 2.339231 1.429336 2.791057 5 4 87 Octane 89 Octane 91 Octane OK Anova: Two-Factor Without Replication Input Input Range $B$4:$G$8 Labels nns 4 90.3 22.575 12.65583333 102.2 25.55 10.40333333 103.2 25.8 18.24666667 EX11-22Solved EX11-24 3.557504 3.22542 4.271612 Cancel 4 Heln EX11-6Solved EX11-8 Type here to search 6:24 PM 2/21/2021 emplate() - Saved e Search File Home insert Daniel Jackson Draw Page Layout Formulas Data Review X Share Arial P Comments Paste Genel 28 B Merge & Center $ - % Conditional Formats Cell Formatting Table Styles Insert Delete Format Clipboard Sort & Find & Filter Select Font Analyze Data 31 Editing Analys . Fuel Efficiency of fleet vehicles D 13 Count Average M N P Q R The Data Analysis is the ony source of this test in Externa we wir use only the Anova: Two Factor Without Replicatoin option. Be careful, there are other ANOVA options. This test is also know as the test since it uses a distribution called the F distribution for comparing variances between groups to the total variance. By analyzing these variances, we can make conclusions about the means in then 5 5 3 12 105 2013 roups 20 > SUMMARY 15 Compact 16 Mid Site 17 Full Size 18 SUV 19 20 87 Octane 21 89 Octane 22 91 Octane 23 Ethanol 5% 24 Ethanol 10% 2 x utage OE Cancel 103 101 91 125667 tutt 27 ANOVA 20 urce of Varat 29 Rows 3 Columns Error 4.5 201512 54.06 2915529157 1351535 115663 EX11 225oved Type here to search o E22 X A D Weekly Sales of People Magazine 1 2 3 Store 2 Store Store Store 1 102 106 TO 115 112 91 2 101 TO 12 13 14 15 19
Step by Step Solution
There are 3 Steps involved in it

Get step-by-step solutions from verified subject matter experts