

Question: These distributions (A & B) look very different. How is it possible that they have the same mean ($1,260)? Explain. A B $0 $1,000
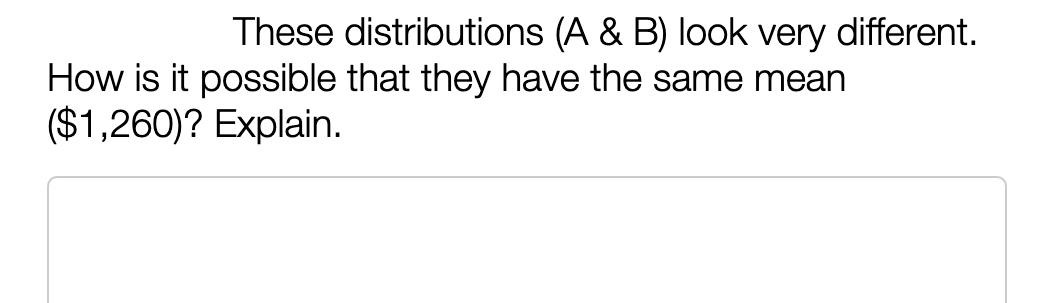
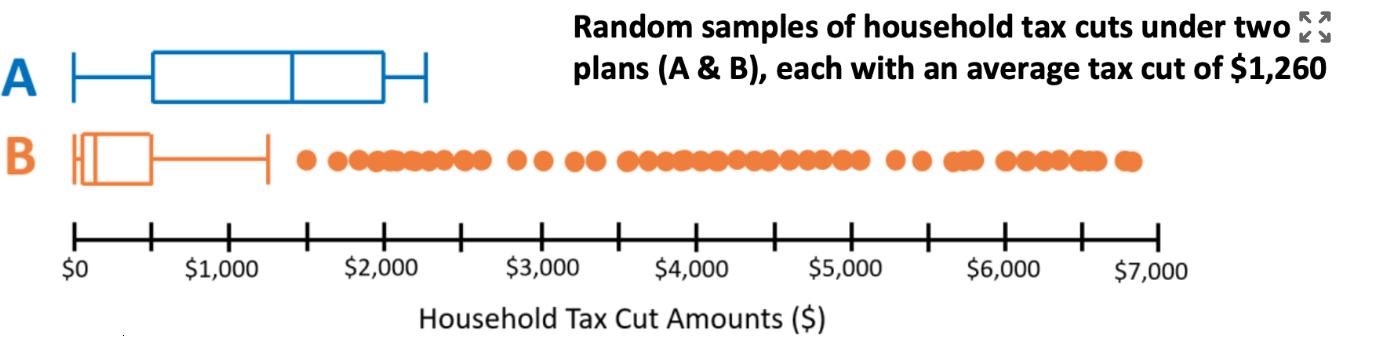
These distributions (A & B) look very different. How is it possible that they have the same mean ($1,260)? Explain. A B $0 $1,000 esnessce $2,000 Random samples of household tax cuts under two plans (A & B), each with an average tax cut of $1,260 000 + + + + $4,000 $3,000 Household Tax Cut Amounts ($) + $5,000 0600 $6,000 RA $7,000
Step by Step Solution
3.42 Rating (155 Votes )
There are 3 Steps involved in it
Based on the boxplots of distributions A and B from the image heres a detailed explanation considering the characteristics of boxplots Mean Value Both ... View full answer

Get step-by-step solutions from verified subject matter experts