

Question: These questions are about Simple Linear Regression, Please do them carefully and the excels that the questions need are in the attachments. Question 1 Which
These questions are about Simple Linear Regression, Please do them carefully and the excels that the questions need are in the attachments.
Question 1
Which of the following statements concerning regression and correlation analysis is/are FALSE?
A. A negative correlation coefficient would be anticipated for the relationship between the unit price and total quantity purchased of wine.
B. In simple linear regression, the choice of which variable is the dependent and which is the independent variable doesn't matter.
C. If two variables displayed a perfect negative linear relationship, then regressing one variable on the other would yield a coefficient of determination of one.
only B
only C
only A and B
only B and C
all three statements are true
Question 2
The Maroochy Chamber of Commerce is interested in determining the relationship between the number of fine days each year and the number of interstate and overseas tourists visiting the Sunshine Coast each year, measured in thousands. Using annual data from 1995 to 2005 (inclusive), the following model was estimated: Y = -6.32 +0.56 X
Error sum of squares:327.6Sum of squares of X: 954.3
Determine the upper limit for the95% confidence interval for the slope correct totwo decimal places.
Question 3
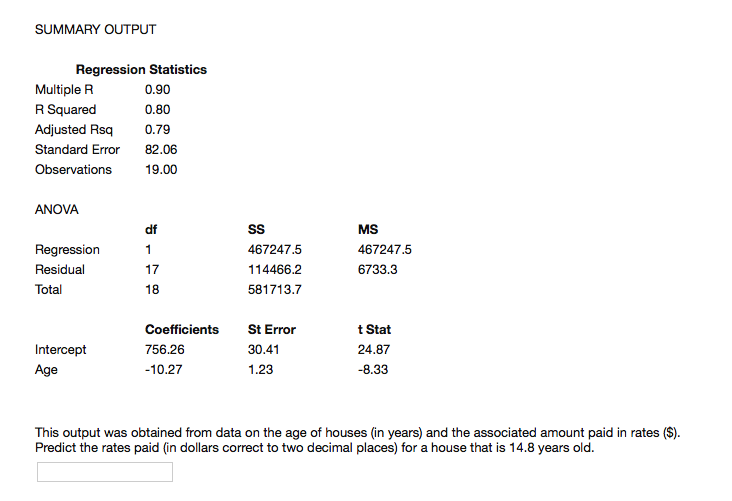
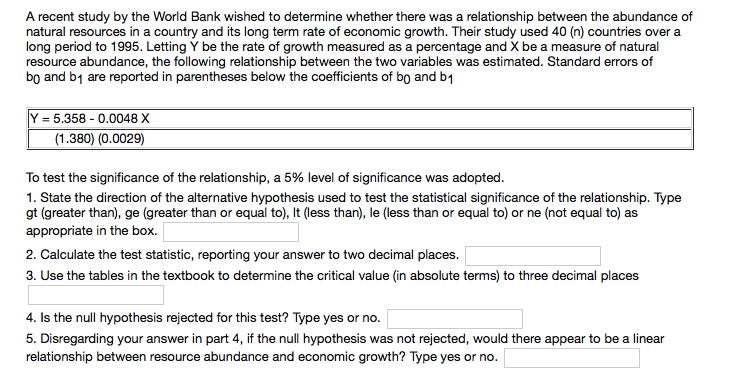
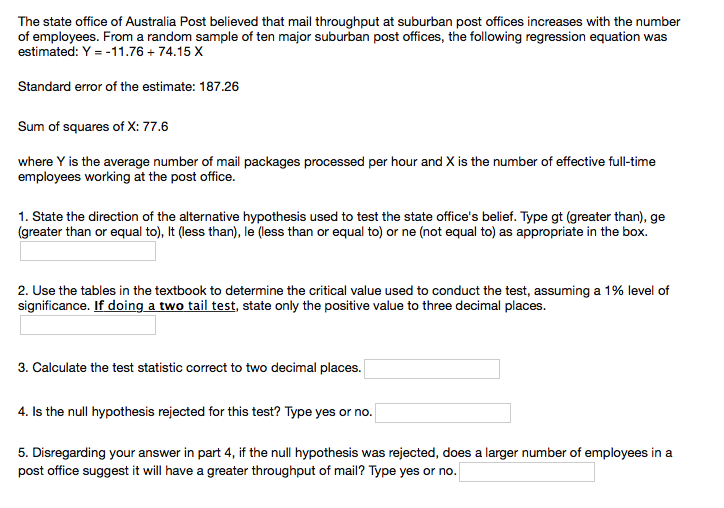
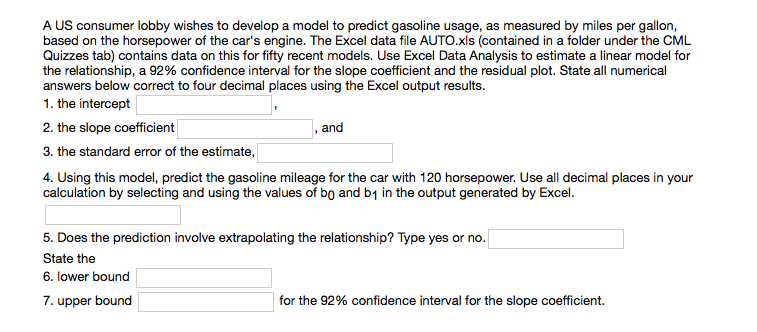
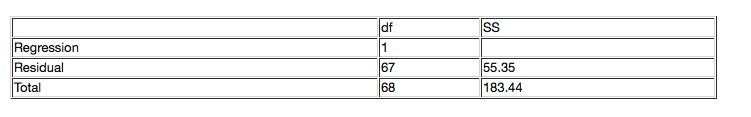
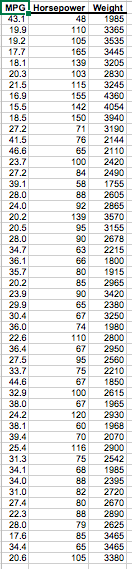
SUMI'H'IAFW OUTPUT Regression Statistics Multiple H 3.33 Ft Squared 3.33 Adjusted Ftsq 3.?9 Standard Error 32.33 Observations 13.33 MOVE df 53 MS Regression 1 43?24?.5 413?24?.5 Residual 1? 1144332 3? 33.3 Total 13 531 1'13} Coefcients St Error t Stet Intercept T53 2'3 33.41 24.3? Age 1 3.2? 1.23 3.33 This output was obtained from data on the age of houses {in years] and the associated amount paid in rates {5}. Predict the rates paid {in dollars correct to two decimal places] for a house that is 14.3 years old. A recent study by the World Bank wished to determine whether there was a relationship between the abundance of natural resources in a country end its long term rate of economic growth. Their study used All] {n} countries over a long period to 1995. Letting Y be the rate of growth measured as a percentage end X be a measure of natural resource abundance. the following relationship between the two 1irariables was estimated. Standard errors of by and b1 are reported in parentheses below the coefficients of bf; and b1 |v = 5.353 some it | {1 .3301 {0.011129} To test the significance of the relationshipI a 5% level of signicance was adopted. 1. State the direction of the altematiye hypothesis used to test the statistical signicance of the relationship. Type gt {greater than]. go {greater than or equal to}. It {less than], le {less than or equal to) or ne {not equal to] as appropriate in the box. 2. Calculate the test statisticr reporting your answer to two decimal places. 3. Use the tables in the textbook to determine the critical value {in absolute terms] to three decimal places 4. Is the null hypothesis rejected for this test? Type yes or no. 5. Disregarding your answer in part 4, if the null hypothesis was not rejected, would there appear to be a linear relationship between resource abundance and economic growth? Type yes or no. The state ofce of Australia Post believed that mail throughput at suburban post ofces increases with the number of employees. From a random sample often major suburban post ofces. the following regression equation was estimated: Y = 11.?5 + F415 X Standard error of the estimate: 18?.26 Sum of squares of X: Fi where Y is the average number of mail packages prooessed per hour and X is the number of effective fulltime employees working at the post off'ne. 1. State the direction of the alternative hypothesis used to test the state office's belief. Type gt [greater than}, ge {greater than or equal to], it [less than}, Ie {less than or equal to] or ne [not equal to] as appropriate in the box. 2. Use the tables in the textbook to determine the critical value used to oonduct the test. assuming a 1% level of signicance. If doing a two tail test, state only the positive value to three decimal places. 3. Calculate the test statistic cement to two decimal places. 4. Is the null hypothesis rejected for this test? Type yes or no. 5. Disregarding your answer in part 4, if the null hypothesis was rejected, does a larger number of employees in a post offioe suggest it will have a greater throughput of mail? Type yes or no. A US consumer lobby wishes to develop a model to predict gasoline usage. as measured by miles per gallonr based on the horsepower of the car's engine. The Excel data le AUTO.xIs [contained in a folder under the GML Quizzes tab] contains data on this for fiftyr recent models. Use Excel Data Analysis to estimate a linear model for the relationshipr a 92% confidence interval for the slope coefficient and the residual plot. State all numerical answers below correct to four decimal places using the Excel output results. 1. the intercept . 2. the slope coefficient , and 3. the standard error of the estimateI 4. Using this modelr predict the gasoline mileage for the car with 120 horsepower. Use all decimal places in your calculation by selecting and using the values of bu. and b1 in the output generated by Excel. 5. Does the prediction involve extrapolating the relationship? Type yes or no. State the 6. lower bound Ti". upper bound for the 9296 confidence interval for the slope coefficient. \f\f
Step by Step Solution
There are 3 Steps involved in it

Get step-by-step solutions from verified subject matter experts