

Question: These questions are to be done in Oracle Live SQL. The ER diagram has been attached below 1. How much total profit was made for
These questions are to be done in Oracle Live SQL. The ER diagram has been attached below
1. How much total profit was made for each product sub-category? Display the total profit and the product sub-category by GROUP BY. Rename the total profit in the result as "TOTAL_PROFIT". Sort the result by the total profit in descending order.
2. Who are the customers with more than five purchases? Display their customer IDs, the numbers of purchases, the total sales, and the average sales per purchase by HAVING. Rename all fields with new appropriate names. Round up numerical values to 3 decimal places.
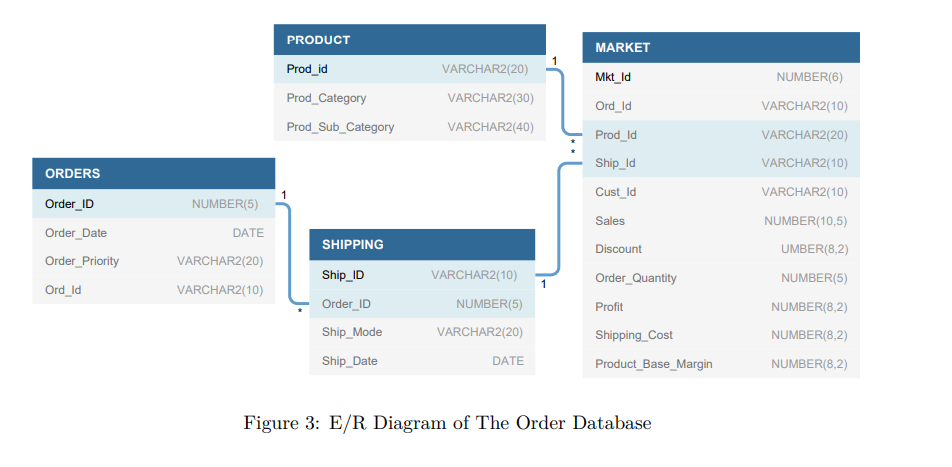
ORDERS Order_ID Order_Date Order_Priority Ord_ld NUMBER(5) DATE VARCHAR2(20) VARCHAR2(10) PRODUCT Prod_id Prod_Category Prod_Sub_Category SHIPPING Ship_ID Order_ID Ship Mode Ship_Date VARCHAR2(20) VARCHAR2(30) VARCHAR2(40) VARCHAR2(10) NUMBER(5) VARCHAR2(20) DATE MARKET Mkt_ld Ord_ld Prod_ld Ship_ld Cust_ld Sales Discount Order Quantity Profit Shipping Cost Product_Base_Margin Figure 3: E/R Diagram of The Order Database NUMBER(6) VARCHAR2(10) VARCHAR2(20) VARCHAR2(10) VARCHAR2(10) NUMBER(10,5) UMBER(8,2) NUMBER(5) NUMBER(8,2) NUMBER(8,2) NUMBER(8,2)
Step by Step Solution
There are 3 Steps involved in it

Get step-by-step solutions from verified subject matter experts