

Think of two numerical questions (with decent ranges and of different topics), that you suspect correlate with
No answer yet for this question.
Ask a Tutor
Question:
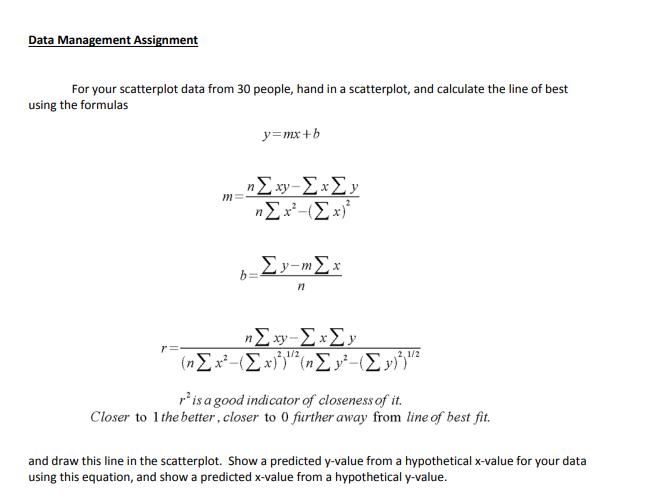
Think of two numerical questions (with decent ranges and of different topics), that you suspect correlate with each other, i.e. as one variable increases in value the other variable will change as well (either increase or decrease).
Calculate the median and interquartile range for the x-values and y-values. Conclude about the consistency of your x and y data using the interquartile range (similar to the standard deviation, the smaller the interquartile range the more consistent the data).
Draw the scatterplot, and calculate the line of best fit and the correlation coefficient. Make two predictions using the equation of the line of best fit.
Expert Answer:

Related Book For 

Microeconomics An Intuitive Approach with Calculus
ISBN: 978-0538453257
1st edition
Authors: Thomas Nechyba
Posted Date:
