

Question: Thirty GPAs from a randomly selected sample of statistics students at a college are given in the accompanying table. Assume that the population distribution is
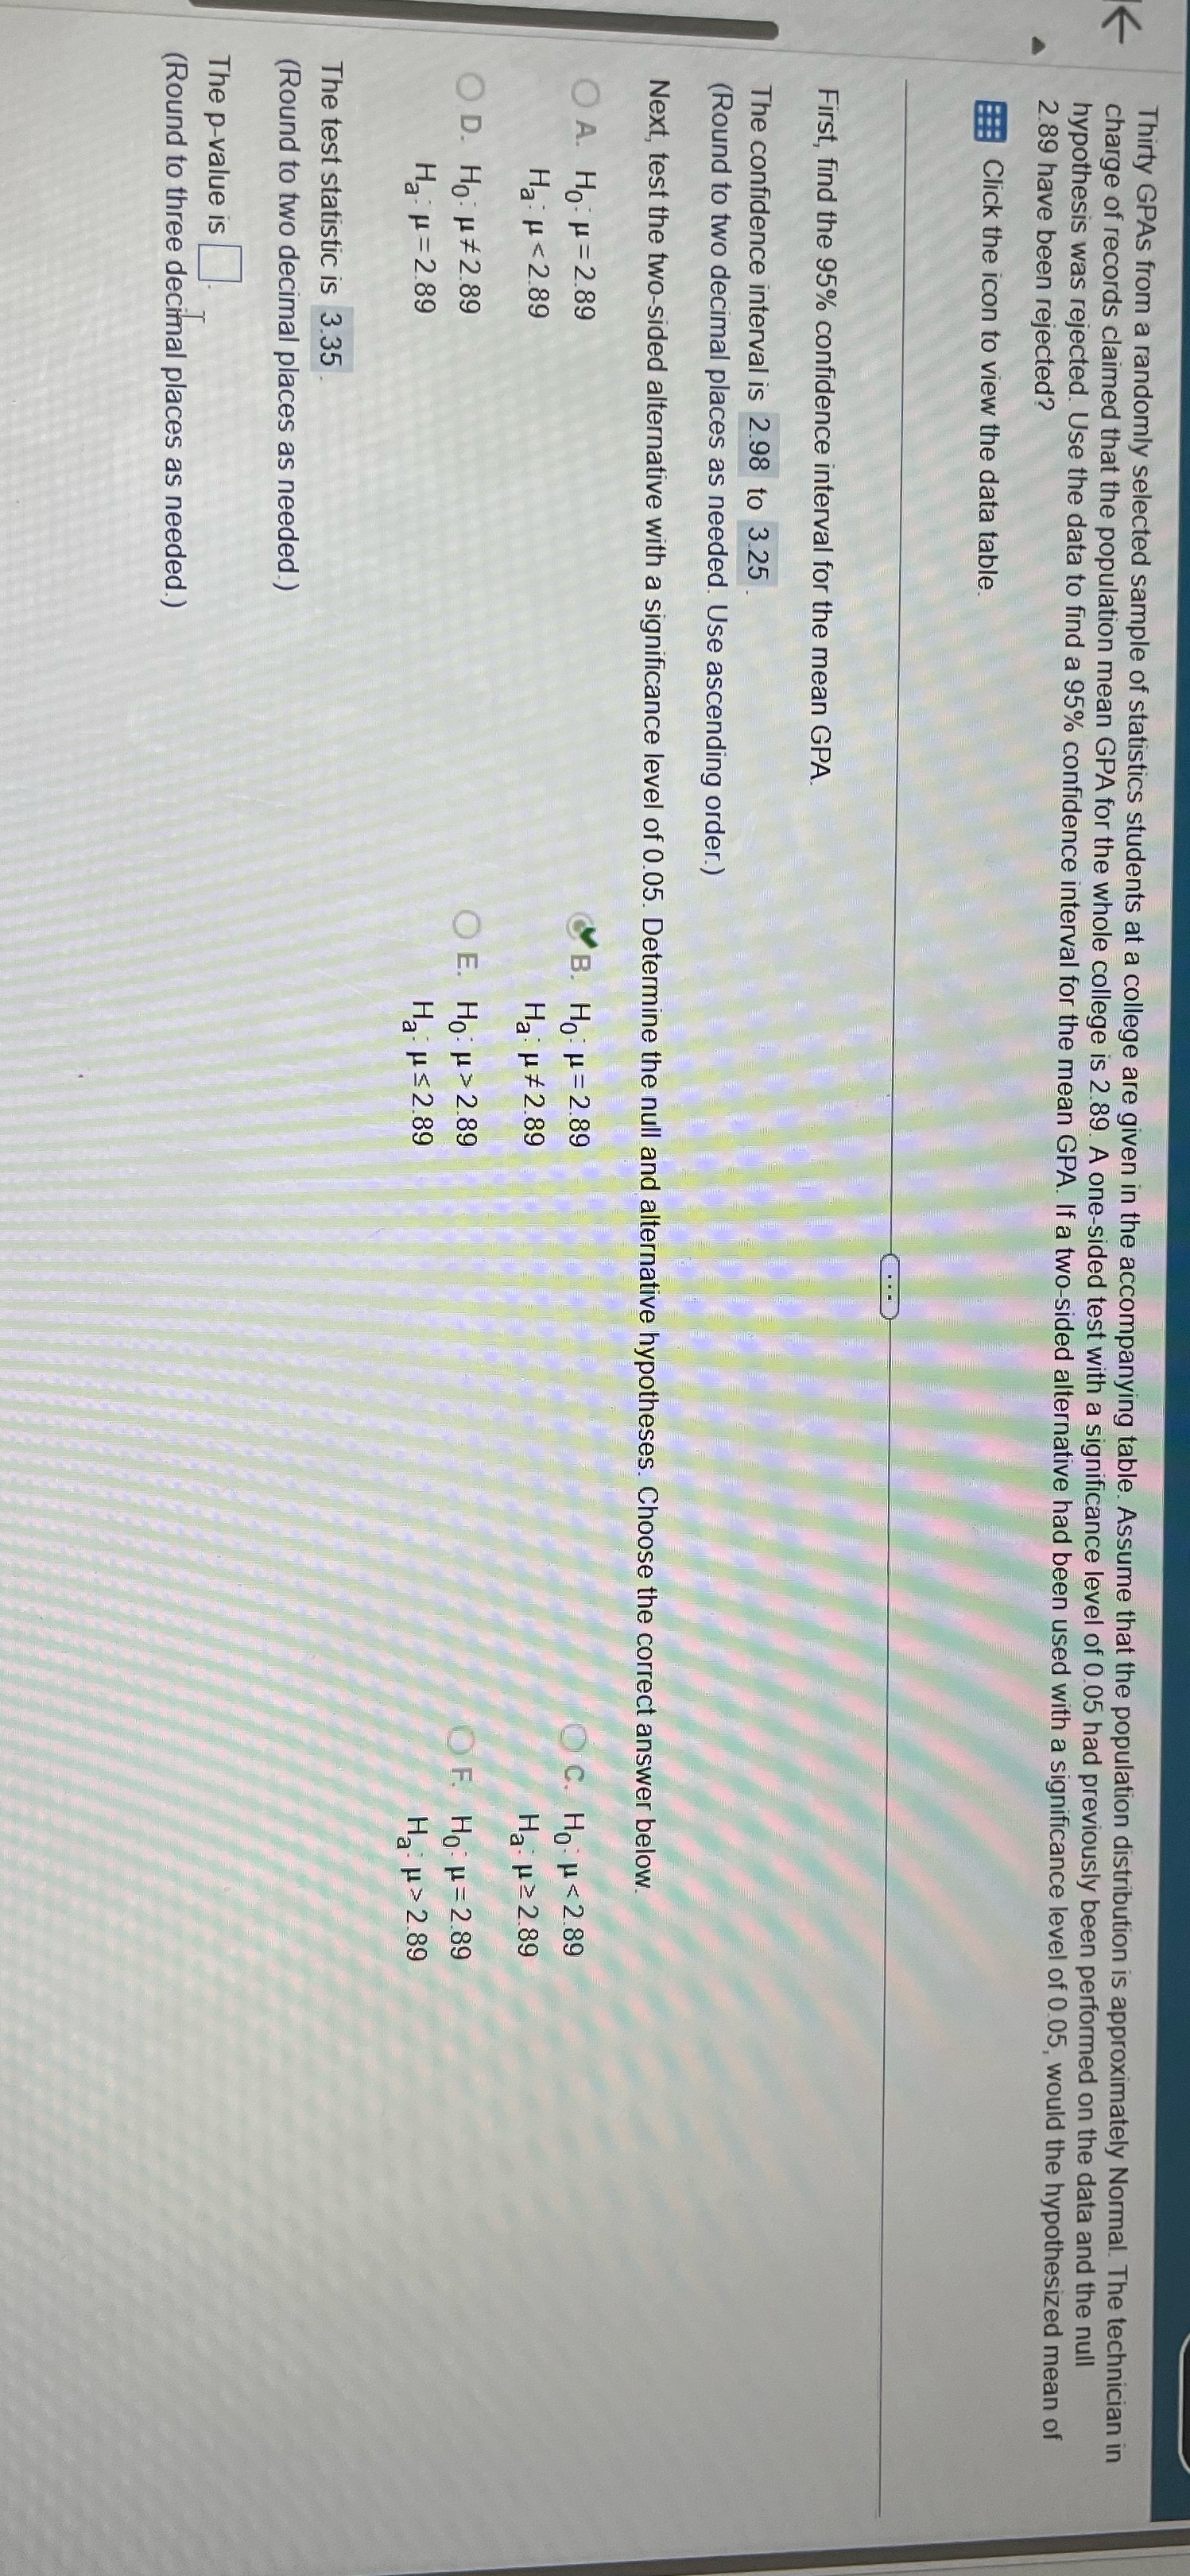
Thirty GPAs from a randomly selected sample of statistics students at a college are given in the accompanying table. Assume that the population distribution is approximately Normal. The technician in V charge of records claimed that the population mean GPA for the whole college is 2.89. A one-sided test with a significance level of 0.05 had previously been performed on the data and the null hypothesis was rejected. Use the data to find a 95% confidence interval for the mean GPA. If a two-sided alternative had been used with a significance level of 0.05, would the hypothesized mean of 2.89 have been rejected? Click the icon to view the data table. First, find the 95% confidence interval for the mean GPA. The confidence interval is 2.98 to 3.25 (Round to two decimal places as needed. Use ascending order.) Next, test the two-sided alternative with a significance level of 0.05. Determine the null and alternative hypotheses. Choose the correct answer below. O A. Ho: H= 2.89 B. Ho: H= 2.89 O C. Ho H 2.89 OF. Ho: H= 2.89 Ha- H= 2.89 Ha : HS2.89 Ha: H > 2.89 The test statistic is 3.35 (Round to two decimal places as needed.) The p-value is (Round to three decimal places as needed.)
Step by Step Solution
There are 3 Steps involved in it

Get step-by-step solutions from verified subject matter experts