

Question: this a R studio assignmnet all the data is on the Mass package Week 8 homework This week you will be working with the crabs
this a R studio assignmnet all the data is on the Mass package
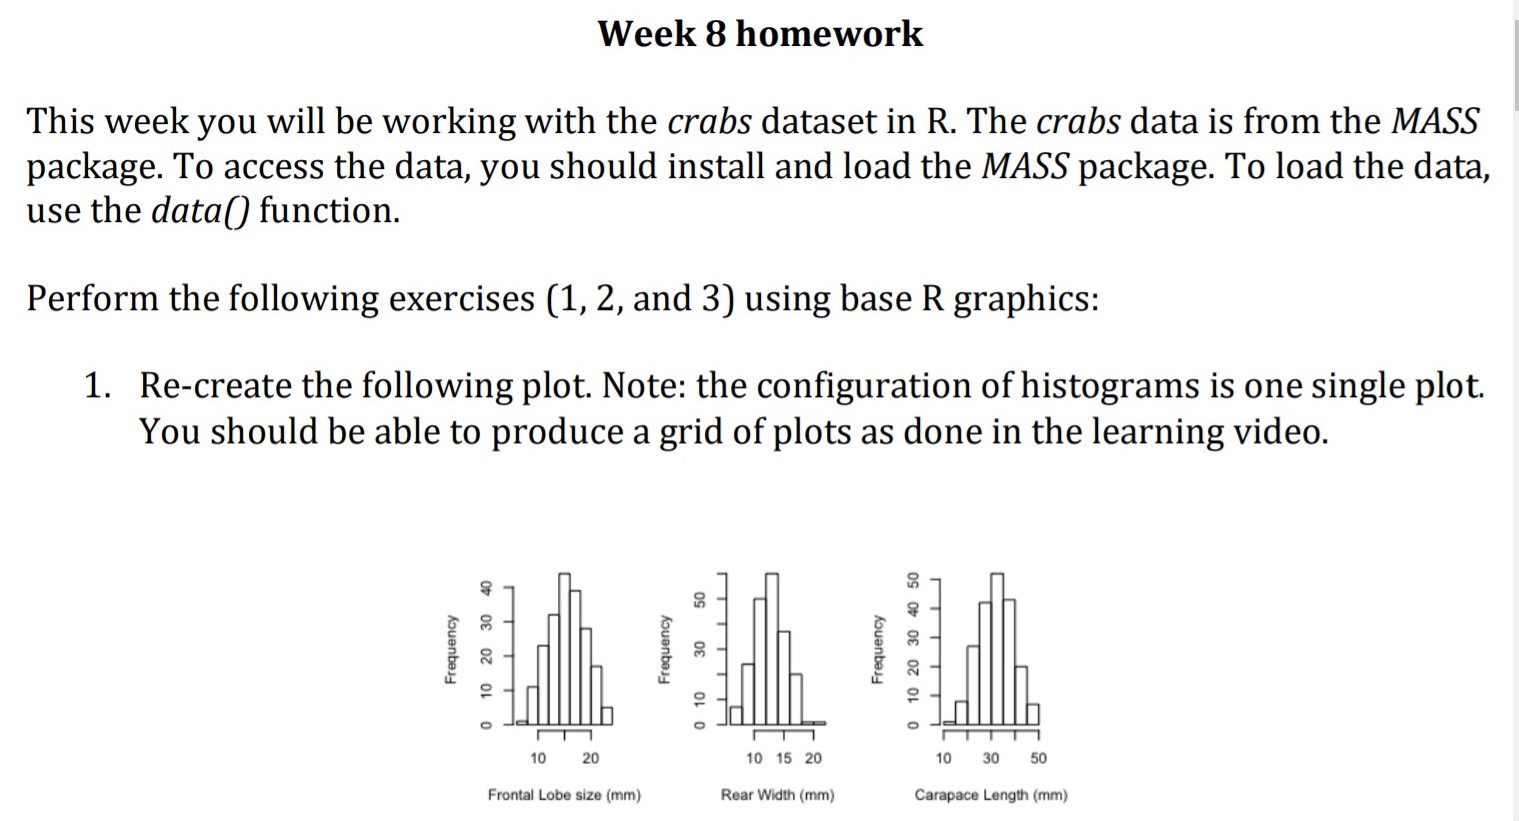
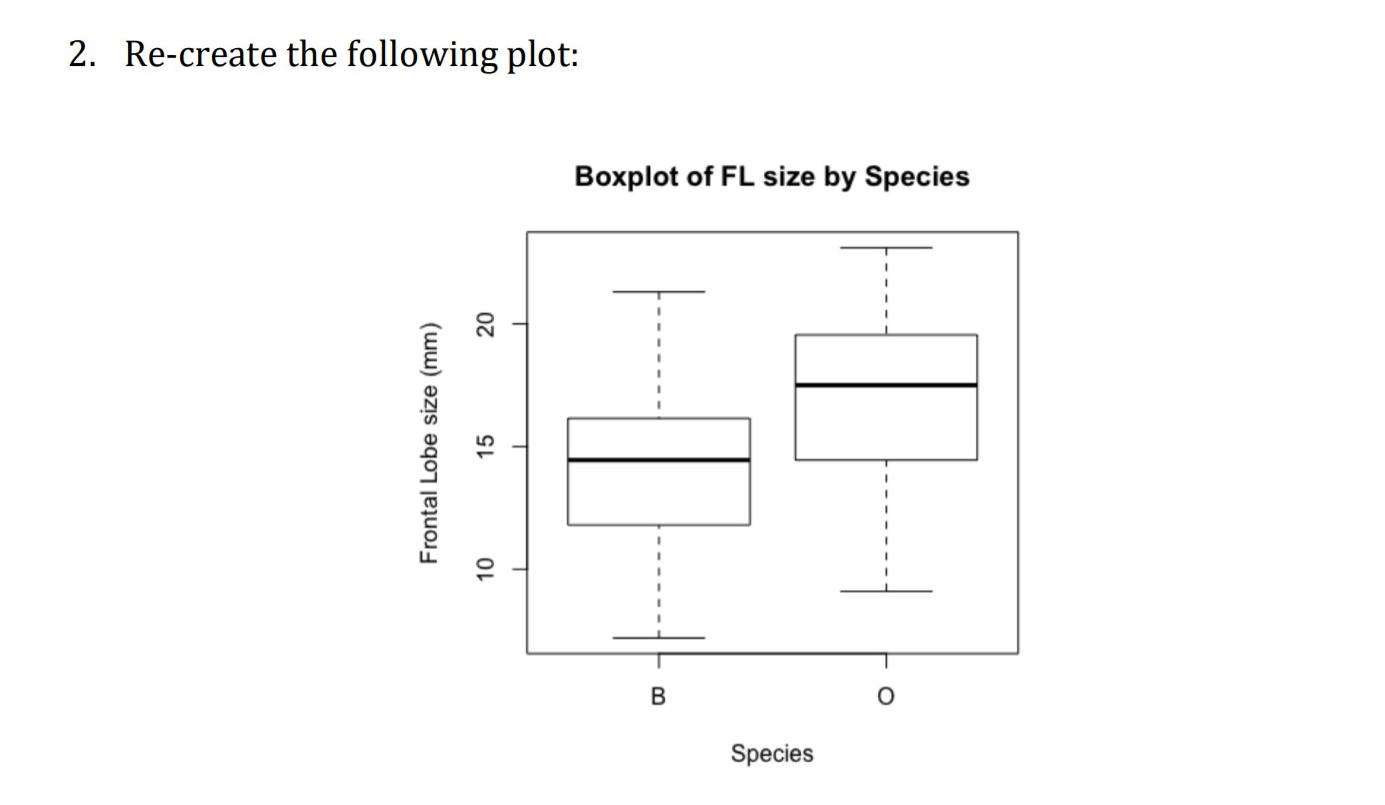
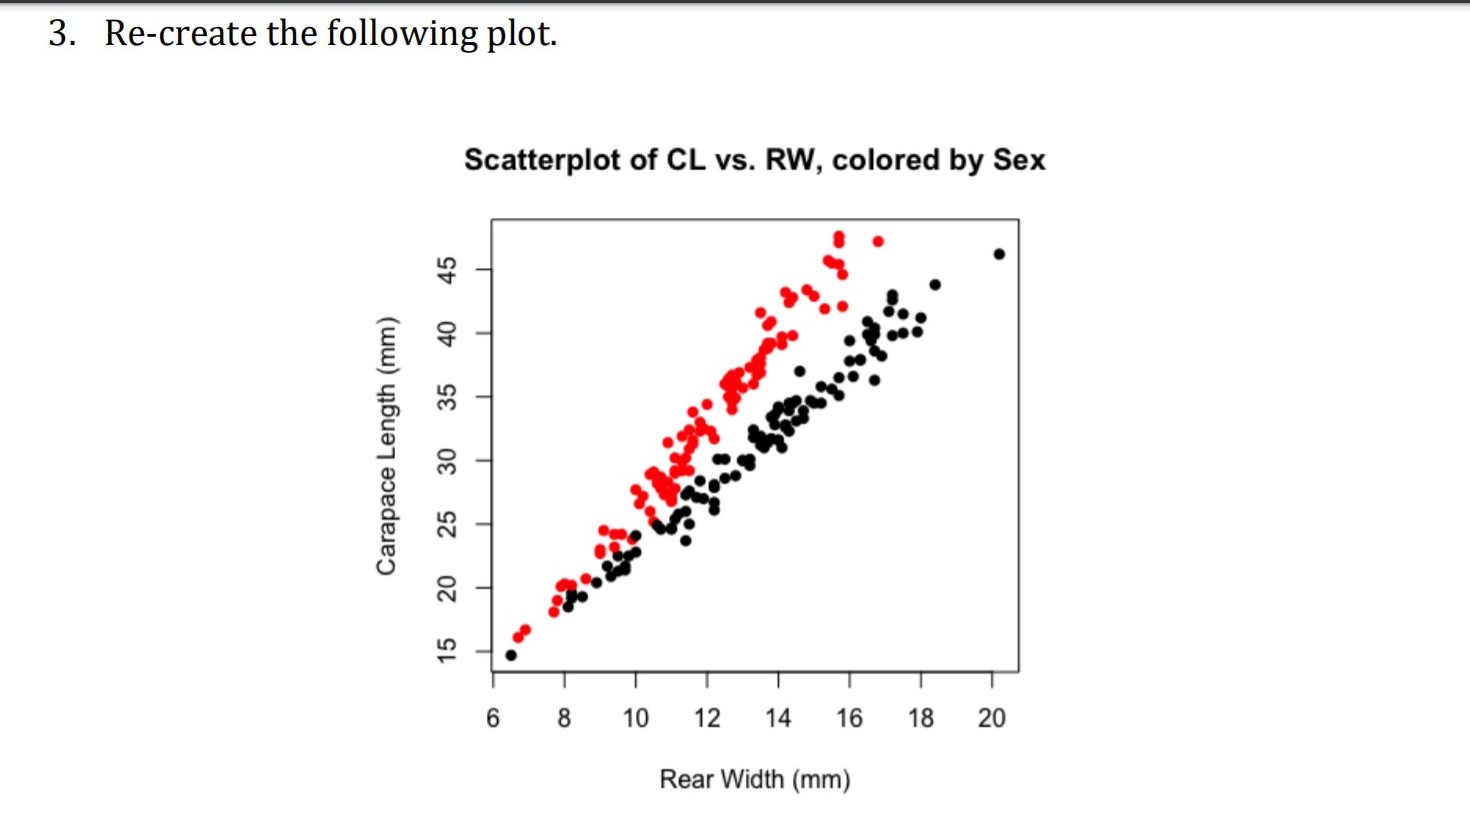
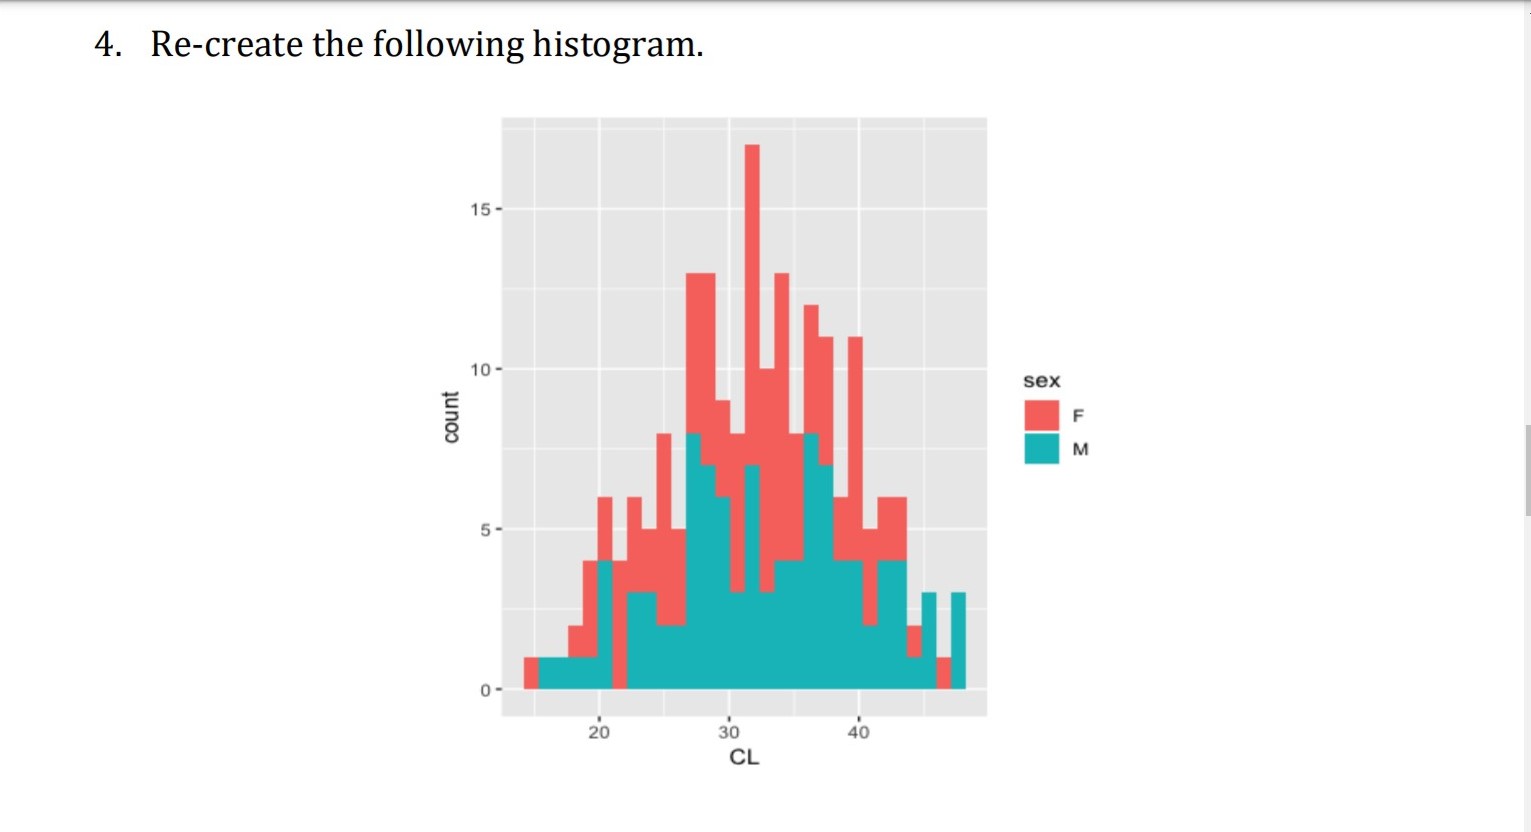
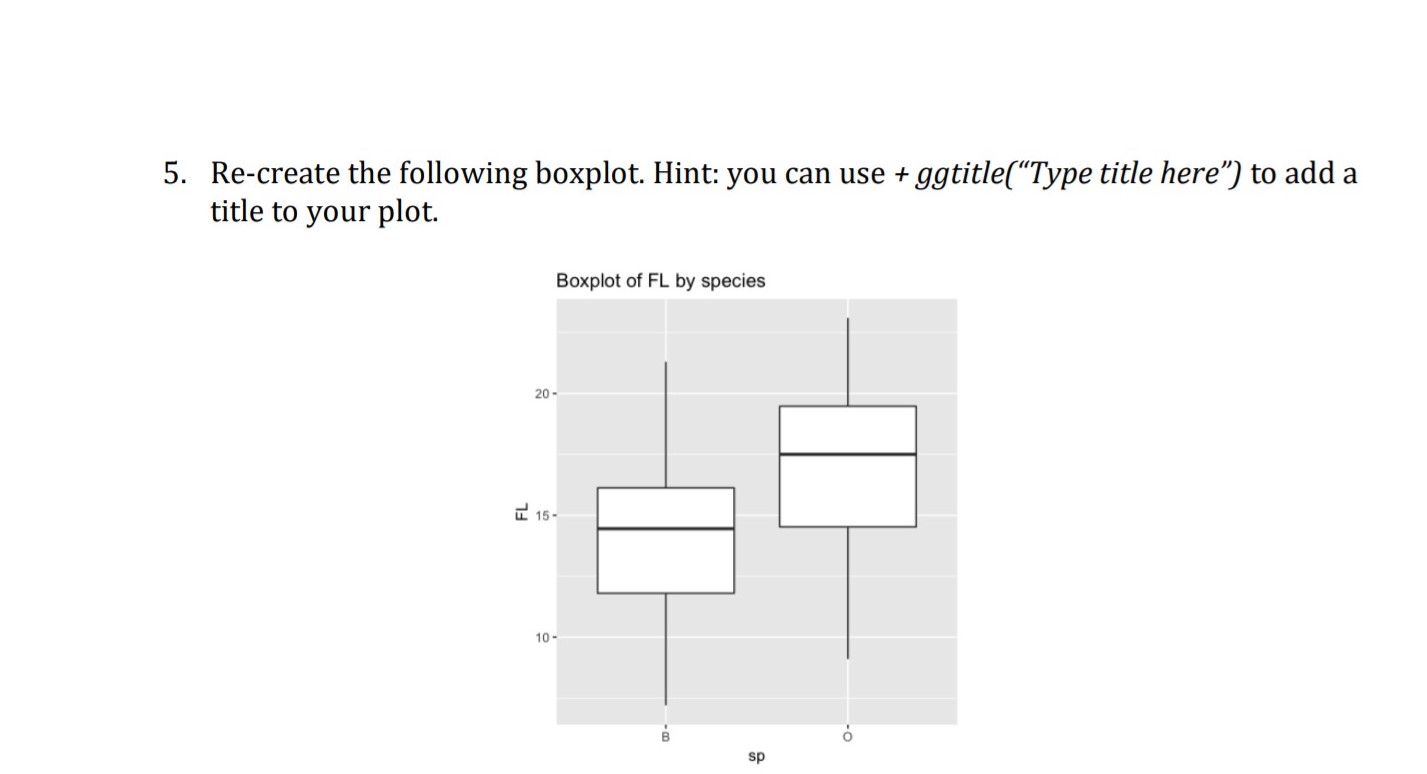
Week 8 homework This week you will be working with the crabs dataset in R. The crabs data is from the MASS package. To access the data, you should install and load the MASS package. To load the data, use the data () function. Perform the following exercises (1, 2, and 3) using base R graphics: 1. Re-create the following plot. Note: the configuration of histograms is one single plot. You should be able to produce a grid of plots as done in the learning video. 40 8 Frequency Frequency Frequency 0 10 20 30 40 50 10 20 30 O 10 20 10 15 20 10 30 50 Frontal Lobe size (mm) Rear Width (mm) Carapace Length (mm)2. Re-create the following plot: Boxplot of FL size by Species Frontal Lobe size (mm) B O Species3. Re-create the following plot. Scatterplot of CL vs. RW, colored by Sex Carapace Length (mm) 15 20 25 30 35 40 45 6 8 10 12 14 16 18 20 Rear Width (mm)\f5. Re-create the following boxplot. Hint: you can use + ggtitle("Type title here") to add a title to your plot. Boxplot of FL by species 20 - LL 15- 10 - CO - O sp59 Extra credit (10 pt): Find a data set that we have not yet used in this course (online, from a package in R, from your research, etc.). Provide a brief description of the data and produce at least two meaningful graphs using base R. Submit your R script and PDF or Word report to the 'Week 8 homework' dropbox folder
Step by Step Solution
There are 3 Steps involved in it

Get step-by-step solutions from verified subject matter experts