

Question: This activity is designed to address course learning objective 5 and is specific to this week's learning objective 5: Analyze data by writing formulas given
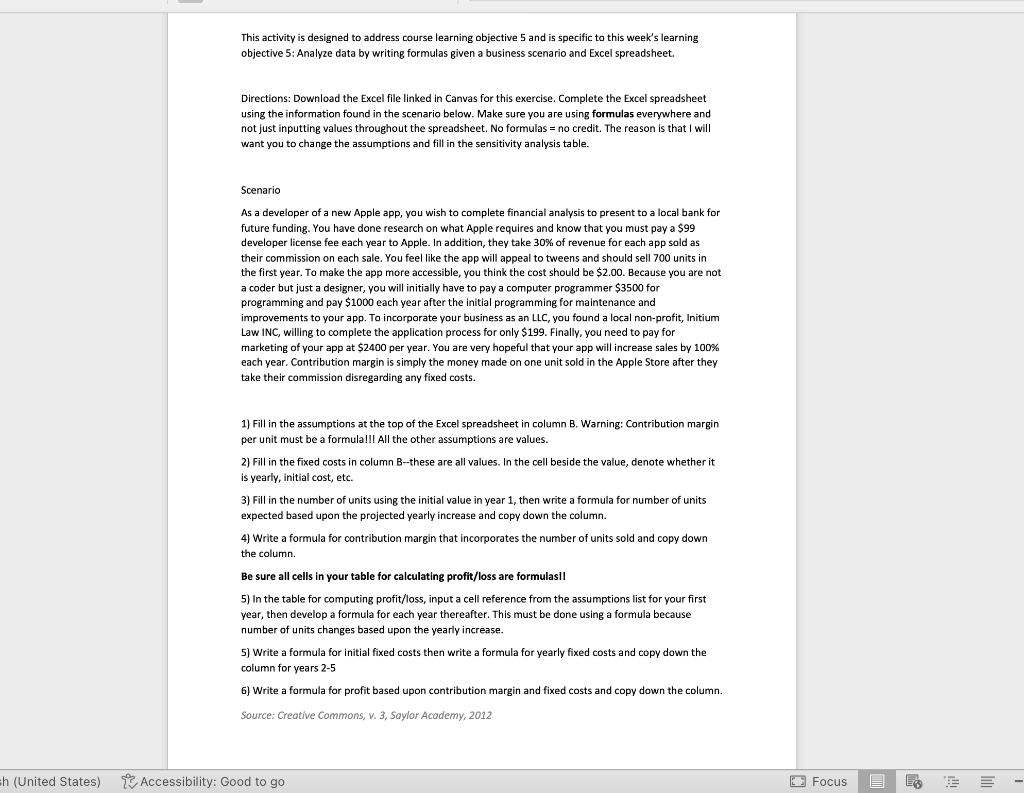
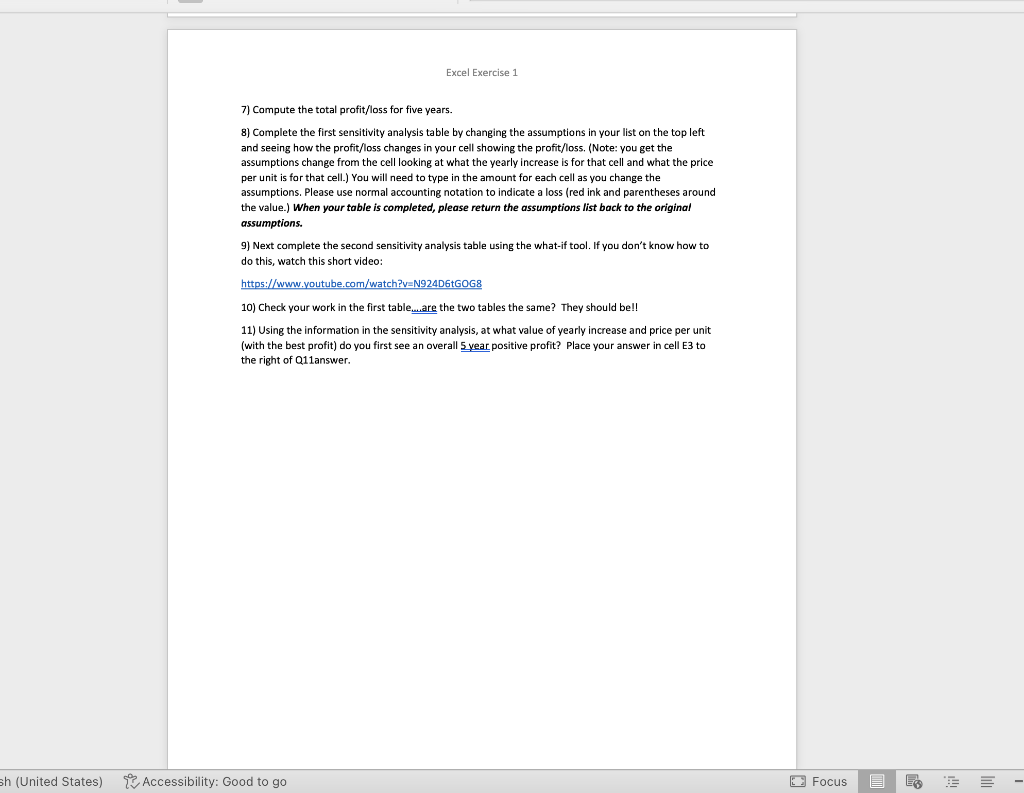
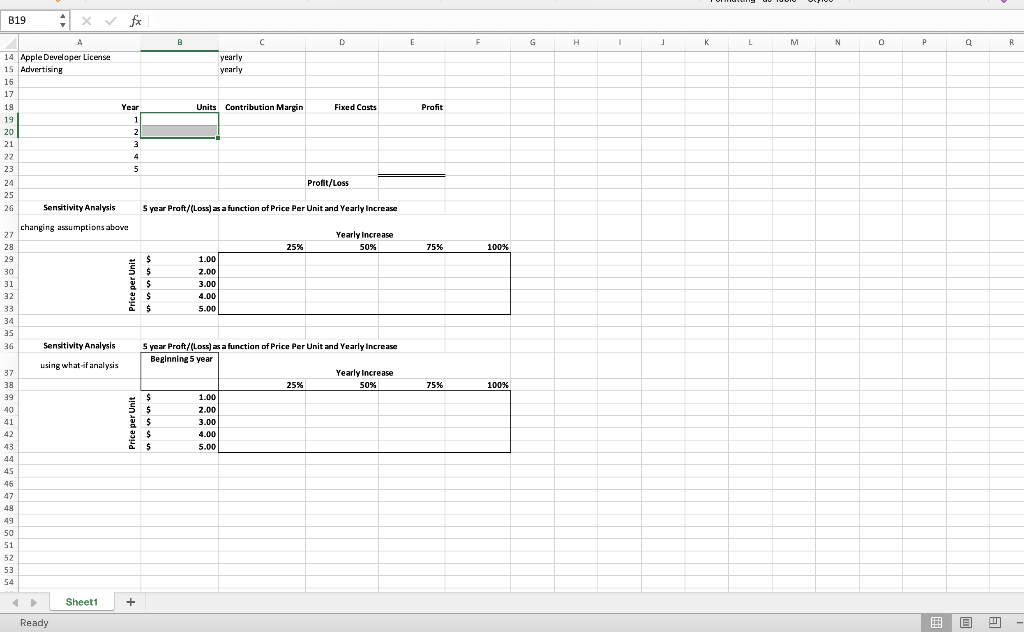
This activity is designed to address course learning objective 5 and is specific to this week's learning objective 5: Analyze data by writing formulas given a business scenario and Excel spreadsheet. Directions: Download the Excel file linked in Canvas for this exercise. Complete the Excel spreadsheet using the information found in the scenario below. Make sure you are using formulas everywhere and not just inputting values throughout the spreadsheet. No formulas = no credit. The reason is that I will want you to change the assumptions and fill in the sensitivity analysis table. Scenario As a developer of a new Apple app, you wish to complete financial analysis to present to a local bank for future funding. You have done research on what Apple requires and know that you must pay a $99 developer license fee each year to Apple. In addition, they take 30% of revenue for each app sold as their commission on each sale. You feel like the app will appeal to tweens and should sell 700 units in the first year. To make the app more accessible, you think the cost should be $2.00. Because you are not a coder but just a designer, you will initially have to pay a computer programmer $3500 for programming and pay $1000 each year after the initial programming for maintenance and improvements to your app. To incorporate your business as an LLC, you found a local non-profit, Initium Law INC, willing to complete the application process for only $199. Finally, you need to pay for marketing of your app at $2400 per year. You are very hopeful that your app will increase sales by 100% each year. Contribution margin is simply the money made on one unit sold in the Apple Store after they take their commission disregarding any fixed costs. 1) Fill in the assumptions at the top of the Excel spreadsheet in column B. Warning: Contribution margin per unit must be a formula!!! All the other assumptions are values. 2) Fill in the fixed costs in column B--these are all values. In the cell beside the value, denote whether it is yearly, initial cost, etc. 3) Fill in the number of units using the initial value in year 1, then write a formula for number of units expected based upon the projected yearly increase and copy down the column. 4) Write a formula for contribution margin that incorporates the number of units sold and copy down the column. Be sure all cells in your table for calculating profit/loss are formulas!! 5) In the table for computing profit/loss, input a cell reference from the assumptions list for your first year, then develop a formula for each year thereafter. This must be done using a formula because number of units changes based upon the yearly increase 5) Write a formula for initial fixed costs then write a formula for yearly fixed costs and copy down the column for years 2-5 6) Write a formula for profit based upon contribution margin and fixed costs and copy down the column. Source: Creative Commons, v. 3, Saylor Academy, 2012 sh (United States) 1 Accessibility: Good to go Focus ES Excel Exercise 1 7) Compute the total profit/loss for five years. 8) Complete the first sensitivity analysis table by changing the assumptions in your list on the top left and seeing how the profit/loss changes in your cell showing the profit/loss. (Note: you get the assumptions change from the cell looking at what the yearly increase is for that cell and what the price per unit is for that cell.) You will need to type in the amount for each cell as you change the assumptions. Please use normal accounting notation to indicate a loss (red ink and parentheses around the value.) When your table is completed, please return the assumptions list back to the original assumptions. 9) Next complete the second sensitivity analysis table using the what-if tool. If you don't know how to do this, watch this short video: https://www.youtube.com/watch?v=N924D6tGOGS 10) Check your work in the first table are the two tables the same? They should be!! 11) Using the information in the sensitivity analysis, at what value of yearly increase and price per unit (with the best profit) do you first see an overall 5 year positive profit? Place your answer in cell E3 to the right of Q11answer. sh (United States) - Accessibility: Good to go Focus ES B19 - x fx B c D E F G H 1 L M N 0 0 P Q R yearly yearly Units Contribution Margin Fixed Costs Profit A 14 Apple Developer License 15 Advertising 16 17 19 19 20 21 22 23 24 25 26 Sensitivity Analysis Year 1 2 zl 3 4 4 5 Profit/Loss 5 year Proft/(Loss) as a function of Price Per Unit and Yearly Increase changing assumptions above Yearly increase 50% 25% % 75% 100% 27 28 29 30 31 32 33 34 35 26 Price per Unit $ $ $ $ $ 1.00 2.00 3.00 4.00 5.00 Sensitivity Analysis using what if analysis 75% 100% 37 38 39 40 41 42 43 44 45 46 47 49 49 5 year Praft/(Loss) as a function of Price Per Unit and Yearly increase Beginning 5 year Yearly Increase 25% 50% $ 1.00 $ 2.00 $ 3.00 $ 4.00 $ 5.00 50 51 52 53 54 Sheet1 + Ready This activity is designed to address course learning objective 5 and is specific to this week's learning objective 5: Analyze data by writing formulas given a business scenario and Excel spreadsheet. Directions: Download the Excel file linked in Canvas for this exercise. Complete the Excel spreadsheet using the information found in the scenario below. Make sure you are using formulas everywhere and not just inputting values throughout the spreadsheet. No formulas = no credit. The reason is that I will want you to change the assumptions and fill in the sensitivity analysis table. Scenario As a developer of a new Apple app, you wish to complete financial analysis to present to a local bank for future funding. You have done research on what Apple requires and know that you must pay a $99 developer license fee each year to Apple. In addition, they take 30% of revenue for each app sold as their commission on each sale. You feel like the app will appeal to tweens and should sell 700 units in the first year. To make the app more accessible, you think the cost should be $2.00. Because you are not a coder but just a designer, you will initially have to pay a computer programmer $3500 for programming and pay $1000 each year after the initial programming for maintenance and improvements to your app. To incorporate your business as an LLC, you found a local non-profit, Initium Law INC, willing to complete the application process for only $199. Finally, you need to pay for marketing of your app at $2400 per year. You are very hopeful that your app will increase sales by 100% each year. Contribution margin is simply the money made on one unit sold in the Apple Store after they take their commission disregarding any fixed costs. 1) Fill in the assumptions at the top of the Excel spreadsheet in column B. Warning: Contribution margin per unit must be a formula!!! All the other assumptions are values. 2) Fill in the fixed costs in column B--these are all values. In the cell beside the value, denote whether it is yearly, initial cost, etc. 3) Fill in the number of units using the initial value in year 1, then write a formula for number of units expected based upon the projected yearly increase and copy down the column. 4) Write a formula for contribution margin that incorporates the number of units sold and copy down the column. Be sure all cells in your table for calculating profit/loss are formulas!! 5) In the table for computing profit/loss, input a cell reference from the assumptions list for your first year, then develop a formula for each year thereafter. This must be done using a formula because number of units changes based upon the yearly increase 5) Write a formula for initial fixed costs then write a formula for yearly fixed costs and copy down the column for years 2-5 6) Write a formula for profit based upon contribution margin and fixed costs and copy down the column. Source: Creative Commons, v. 3, Saylor Academy, 2012 sh (United States) 1 Accessibility: Good to go Focus ES Excel Exercise 1 7) Compute the total profit/loss for five years. 8) Complete the first sensitivity analysis table by changing the assumptions in your list on the top left and seeing how the profit/loss changes in your cell showing the profit/loss. (Note: you get the assumptions change from the cell looking at what the yearly increase is for that cell and what the price per unit is for that cell.) You will need to type in the amount for each cell as you change the assumptions. Please use normal accounting notation to indicate a loss (red ink and parentheses around the value.) When your table is completed, please return the assumptions list back to the original assumptions. 9) Next complete the second sensitivity analysis table using the what-if tool. If you don't know how to do this, watch this short video: https://www.youtube.com/watch?v=N924D6tGOGS 10) Check your work in the first table are the two tables the same? They should be!! 11) Using the information in the sensitivity analysis, at what value of yearly increase and price per unit (with the best profit) do you first see an overall 5 year positive profit? Place your answer in cell E3 to the right of Q11answer. sh (United States) - Accessibility: Good to go Focus ES B19 - x fx B c D E F G H 1 L M N 0 0 P Q R yearly yearly Units Contribution Margin Fixed Costs Profit A 14 Apple Developer License 15 Advertising 16 17 19 19 20 21 22 23 24 25 26 Sensitivity Analysis Year 1 2 zl 3 4 4 5 Profit/Loss 5 year Proft/(Loss) as a function of Price Per Unit and Yearly Increase changing assumptions above Yearly increase 50% 25% % 75% 100% 27 28 29 30 31 32 33 34 35 26 Price per Unit $ $ $ $ $ 1.00 2.00 3.00 4.00 5.00 Sensitivity Analysis using what if analysis 75% 100% 37 38 39 40 41 42 43 44 45 46 47 49 49 5 year Praft/(Loss) as a function of Price Per Unit and Yearly increase Beginning 5 year Yearly Increase 25% 50% $ 1.00 $ 2.00 $ 3.00 $ 4.00 $ 5.00 50 51 52 53 54 Sheet1 + Ready
Step by Step Solution
There are 3 Steps involved in it

Get step-by-step solutions from verified subject matter experts