

Question: This activity is important because it will demonstrate how quickly data visualization can help you understand business insights even if this is your first time
This activity is important because it will demonstrate how quickly data visualization can help you understand business insights even if this is your first time seeing the business problem.
The goal of this activity is to demonstrate how insights can be derived from a data visualization.
Select your answer to each of the multiple choice questions based on the data contained in the following charts.
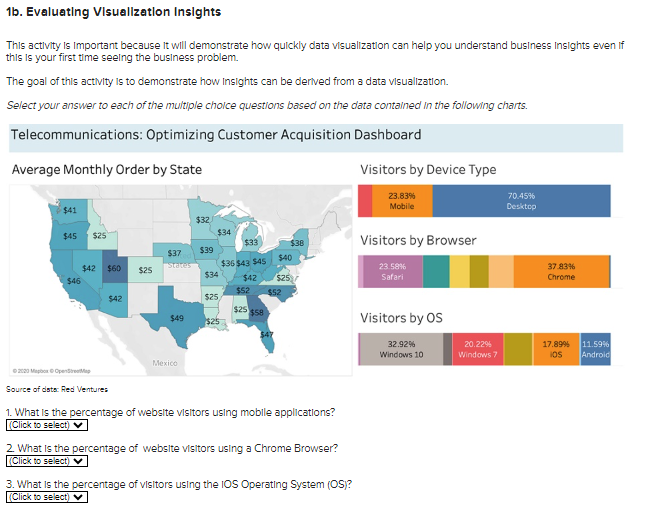
"Average monthly order by state:Washington: 41$, Oregon: 45$, California: 46$, Idaho: 25$, Nevada: 42$, Utah: 60$, Arizona: 42$, Colorado: 25$, Nebraska: 37$, Texas: 49$, Minnesota: 32$, Iowa: 39$, Missouri: 34$, Arkansas: 25$, Louisiana: 25$, Wisconsin: 34$, Illinois: 36$, Michigan: 33$, Indiana: 43$, Ohio: 45$, Kentucky: 42$, Tennessee: 52$, Alabama: 25$, Georgia: 58$, Florida: 47$, Michigan: 33$, New York: 38$, Pennsylvania: 40$, Virginia: 25$, and North Carolina: 52$.Set of three horizontal bar graphs shows data as follows:Visitor by device type: Mobile: 23.83% mobile and 70.45% desktop.Visitors by browser: Safari: 23.58% and 37.83% chrome.Visitor by OS: Windows 10: 32.92%, Windows 7: 20.22%, iOS: 17.89%, and android: 11.59%."
Source of data: Red Ventures
1. What is the percentage of website visitors using mobile applications?
(Click to select) 17.89% 23.83% 23.58% 37.83%
2. What is the percentage of website visitors using a Chrome Browser?
(Click to select) 17.89% 23.83% 23.58% 37.83%
3. What is the percentage of visitors using the iOS Operating System (OS)?
(Click to select) 17.89% 23.83% 23.58% 37.83%
1b. Evaluating VIsualization Insights This activity is Important because It will demonstrate how quickly data visualization can help you understand business insights even if this is your first time seelng the business problem. The goal of this activity is to demonstrate how insights can be derived from a data visualization. Select your answer to each of the multiple choice questions based on the data contalned in the following charts. Telecommunications: Optimizing Customer Acquisition Dashboard Average Monthly Order by State Visitors by Device Type Visitors by Browser Visitors by OS Source of dots: Red Ventures 1. What is the oercentage of website visitors using mobile applications? 2. What is the percentage of website visitors using a Chrome Browser? 3. What is the dercentage of visitors using the IOS Operating System (OS)
Step by Step Solution
There are 3 Steps involved in it

Get step-by-step solutions from verified subject matter experts