

Question: this answer is correct I need you to show me what data they used to graph it like this. pls like a breakdown of how
this answer is correct I need you to show me what data they used to graph it like this. pls like a breakdown of how they calculated everything. pls
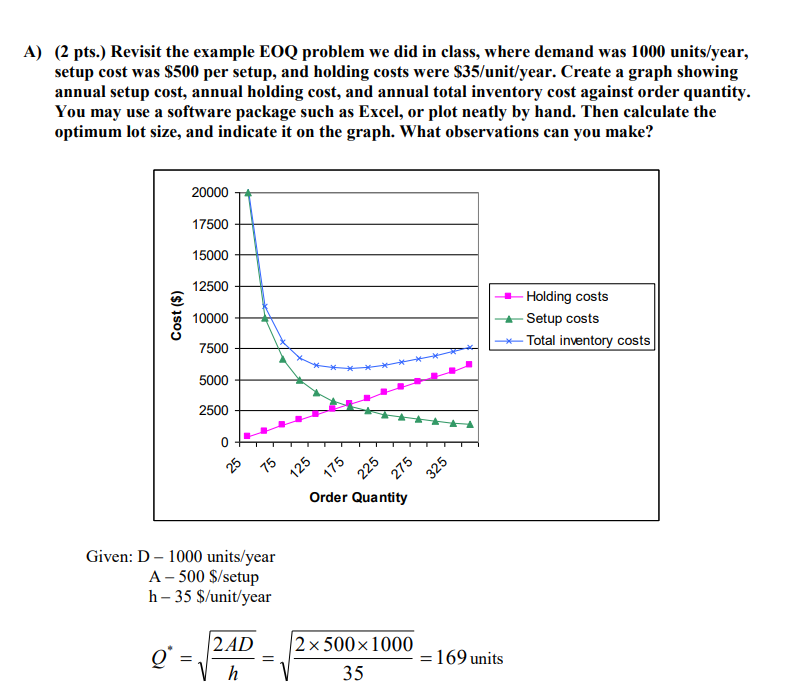
(2 pts.) Revisit the example EOQ problem we did in class, where demand was 1000 units/year, setup cost was $500 per setup, and holding costs were $35/ unit/year. Create a graph showing annual setup cost, annual holding cost, and annual total inventory cost against order quantity. You may use a software package such as Excel, or plot neatly by hand. Then calculate the optimum lot size, and indicate it on the graph. What observations can you make? Given: D - 1000 units/year A - 500$/ setup h35$/ unit/year Q=h2AD=3525001000=169units (2 pts.) Revisit the example EOQ problem we did in class, where demand was 1000 units/year, setup cost was $500 per setup, and holding costs were $35/ unit/year. Create a graph showing annual setup cost, annual holding cost, and annual total inventory cost against order quantity. You may use a software package such as Excel, or plot neatly by hand. Then calculate the optimum lot size, and indicate it on the graph. What observations can you make? Given: D - 1000 units/year A - 500$/ setup h35$/ unit/year Q=h2AD=3525001000=169units
Step by Step Solution
There are 3 Steps involved in it

Get step-by-step solutions from verified subject matter experts