

Question: This assignment assesses your skills/knowledge on identifying functions, the domain and range, using functions to calculate the rate of change and extrema, and interpret the
This assignment assesses your skills/knowledge on identifying functions, the domain and range, using functions to calculate the rate of change and extrema, and interpret the graphs of functions.
In order to model real-world scenarios and transformations with limits, it's important for us to understand functions, domains, and ranges. Additionally, proficiency in rate of change and slopes helps with analyzing dynamic processes and data trends. Knowledge of extrema enables us to optimize problem-solving and time management. With this understanding, please answer the following questions and show stepwise calculations. Please explain your reasoning wherever necessary.
You are required to complete all the 5 tasks in this assignment. When you are instructed to make a graph in this assignment,please useGeoGebra graphing tool.
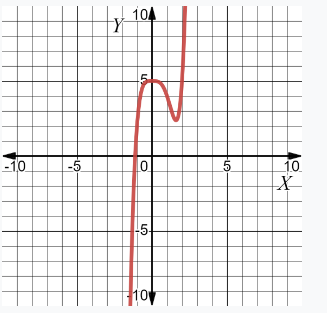
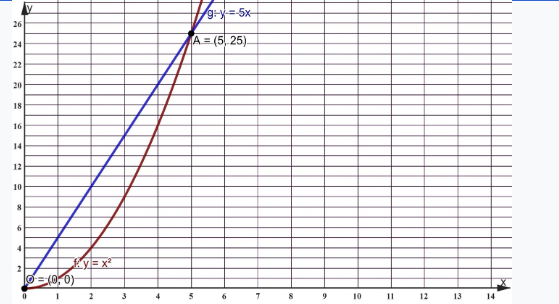
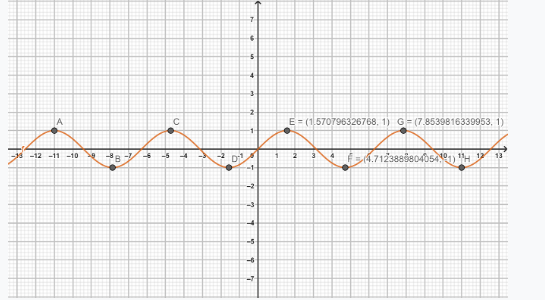
Task1. Interpret the following graph in detail:
104 -10 -5 0 109:y =-5x 24 A = (5, 25) 20 18 16 14 12 10 O = (0, 0) 1 2 3 4 5 T 9 10 11 12 13 14A C E= (1.570796326768, 1) G = (7.8539816339953, 1) -12 -11 -10 9 8 -7 -5 -4 3 D1 1 2 3 (= 14.7123885804054181) 1- 12 13 -1 -T
Step by Step Solution
There are 3 Steps involved in it

Get step-by-step solutions from verified subject matter experts