

Question: This assessment includes four different graphs. Analyze the graphs, and answer the ten questions about them. Submit the attached file as your assignment, once completed.
This assessment includes four different graphs. Analyze the graphs, and answer the ten questions about them. Submit the attached file as your assignment, once completed.
What would happen to the curves in each of the following scenarios? To answer this question, write the letter of the graph you would use in each scenario.
- There was a freeze in the orange groves and much of the crop was lost.
- A new report came out that said oranges have more antioxidants than other fruits.
- There was a “baby boom” and the population doubled.
- New government regulations increased the tax on all oranges.
- A subsidy was created to decrease the price of fruit.
- Orange seedlings were cheaper relative to other seedlings.
- Producers switched from growing apples to growing oranges due to climate change.
- A report came out that said oranges cause heart disease.
- Irrigation equipment (an input of growing oranges) increased in price.
- Apples (a substitute for oranges) went down in price.
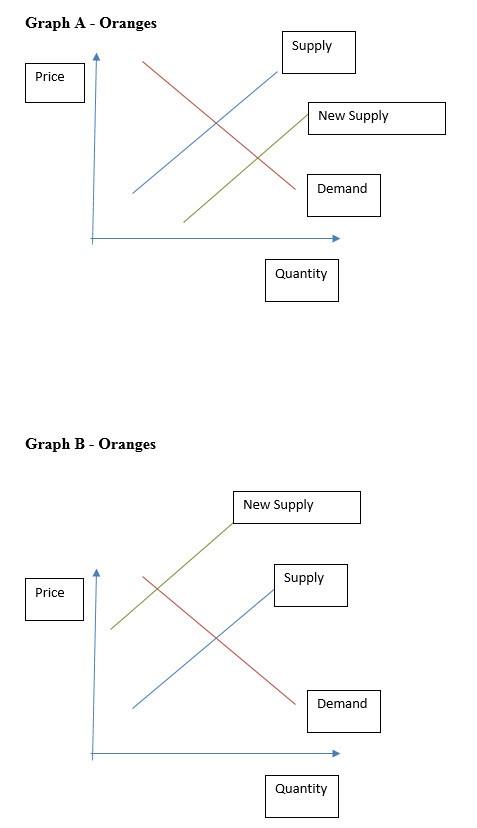
Graph A - Oranges Supply Price New Supply Demand Quantity Graph B - Oranges New Supply Supply Price Demand Quantity
Step by Step Solution
3.56 Rating (153 Votes )
There are 3 Steps involved in it
ANSWER Answer The demand for and the supply of a good depend on the price of the goodWhen the quanti... View full answer

Get step-by-step solutions from verified subject matter experts