

Question: This assignment is a classical commodity distribution problem hat can be modelled using networks. It is described in the Case Study Case: Hollingsworth Paper
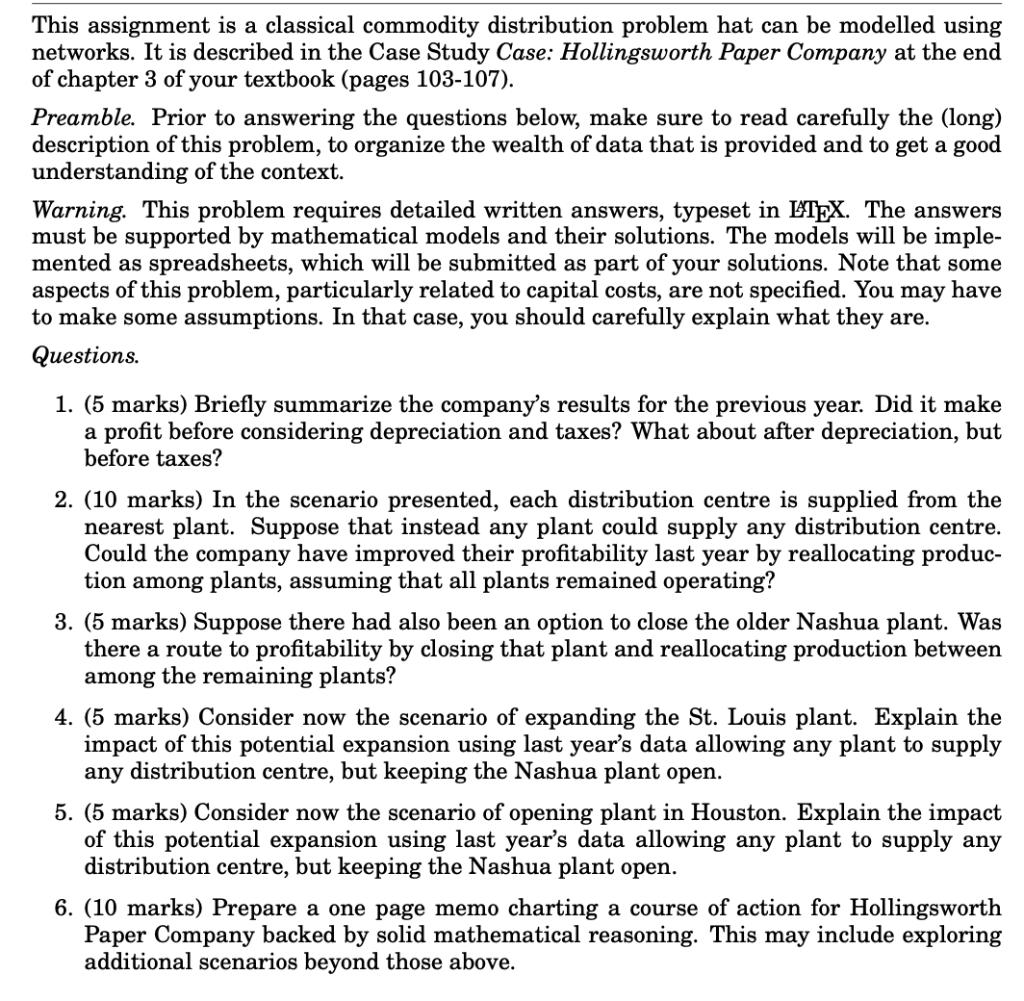
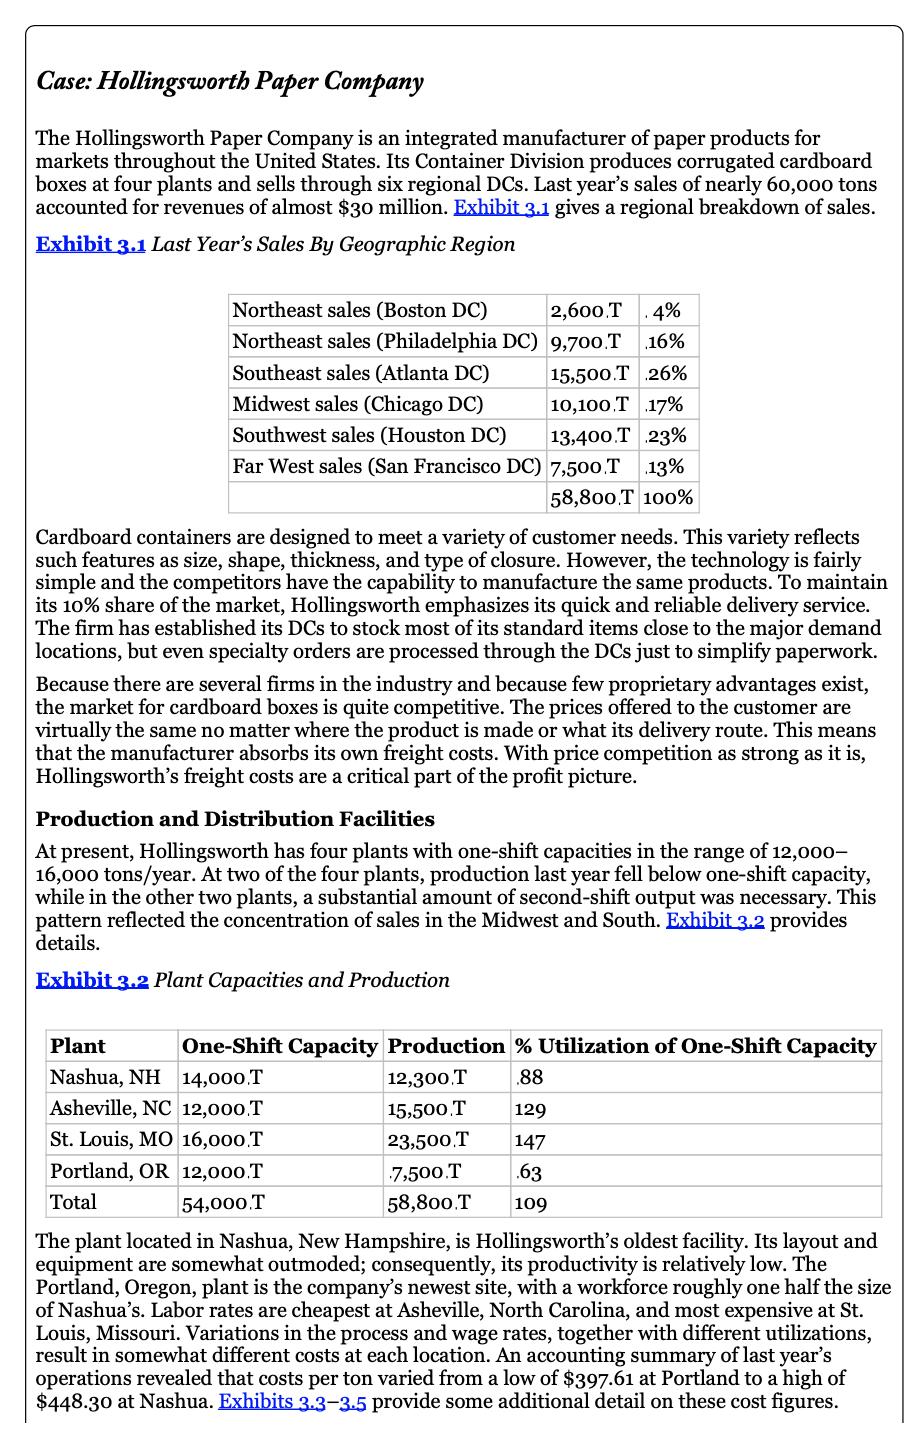
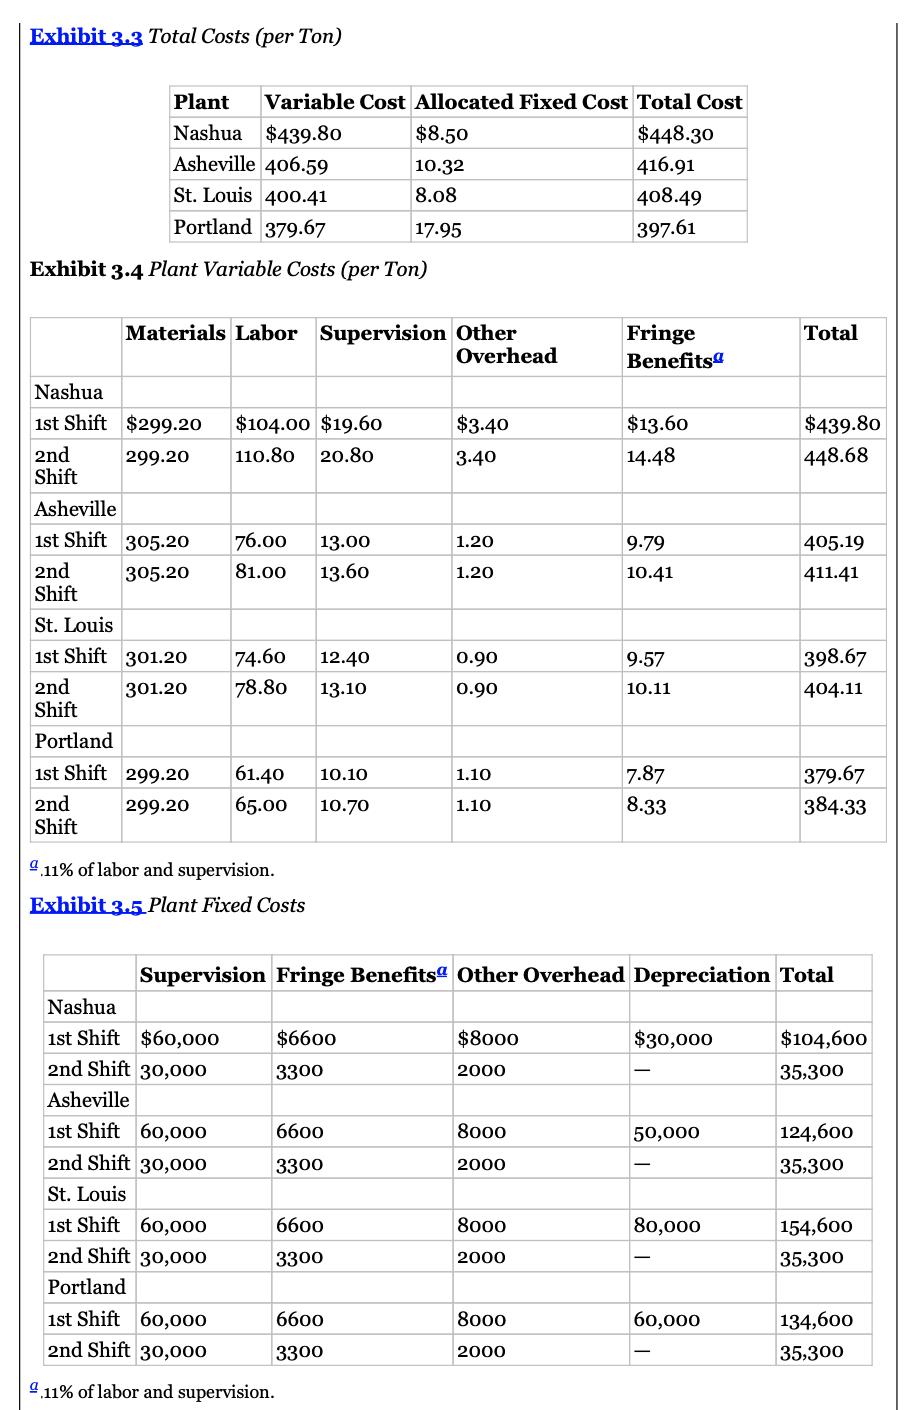
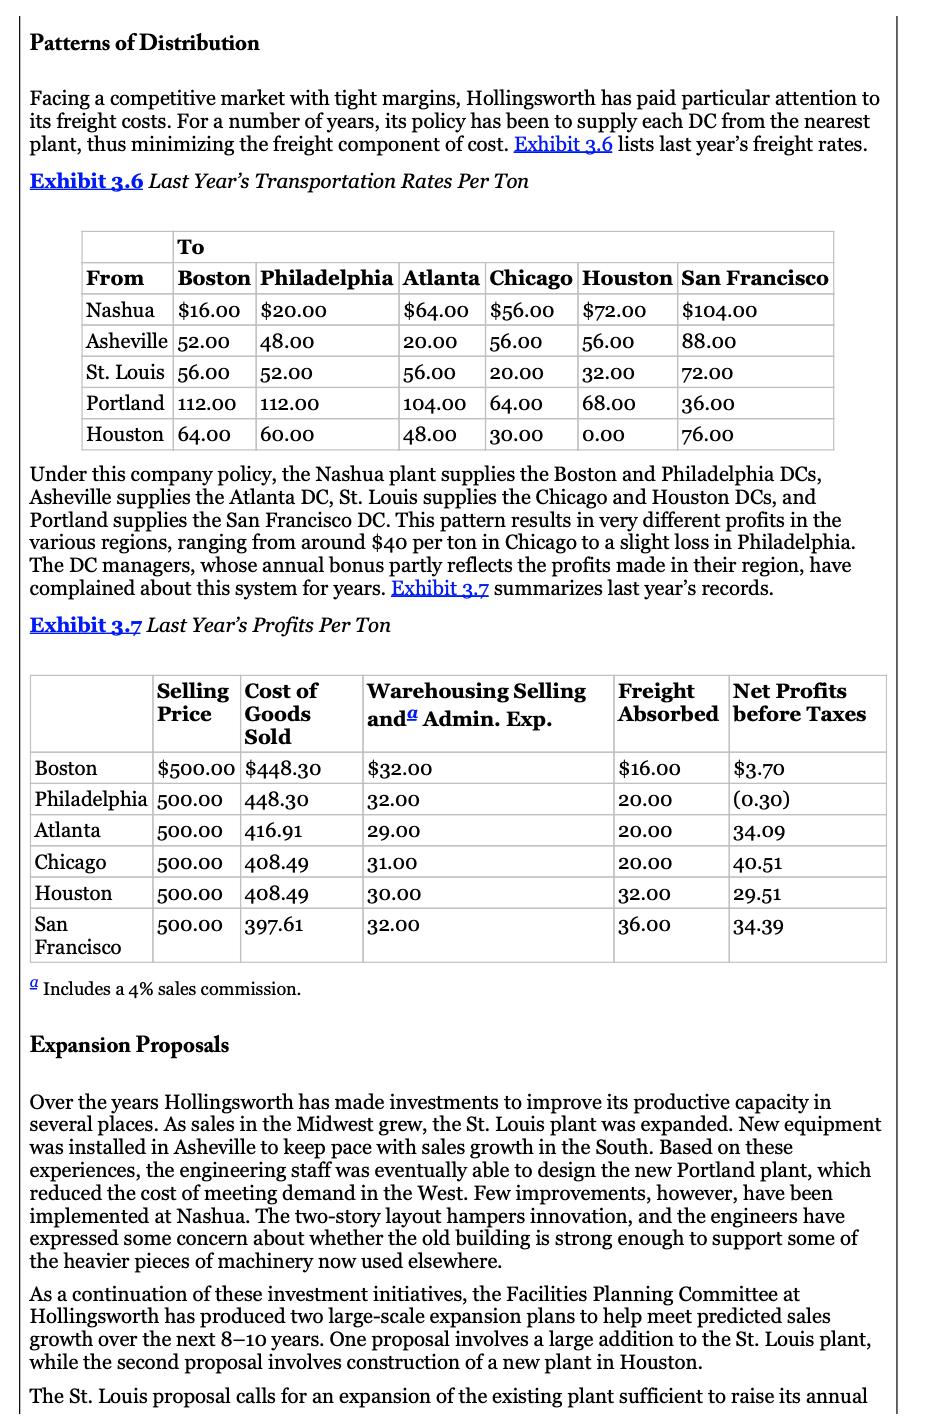
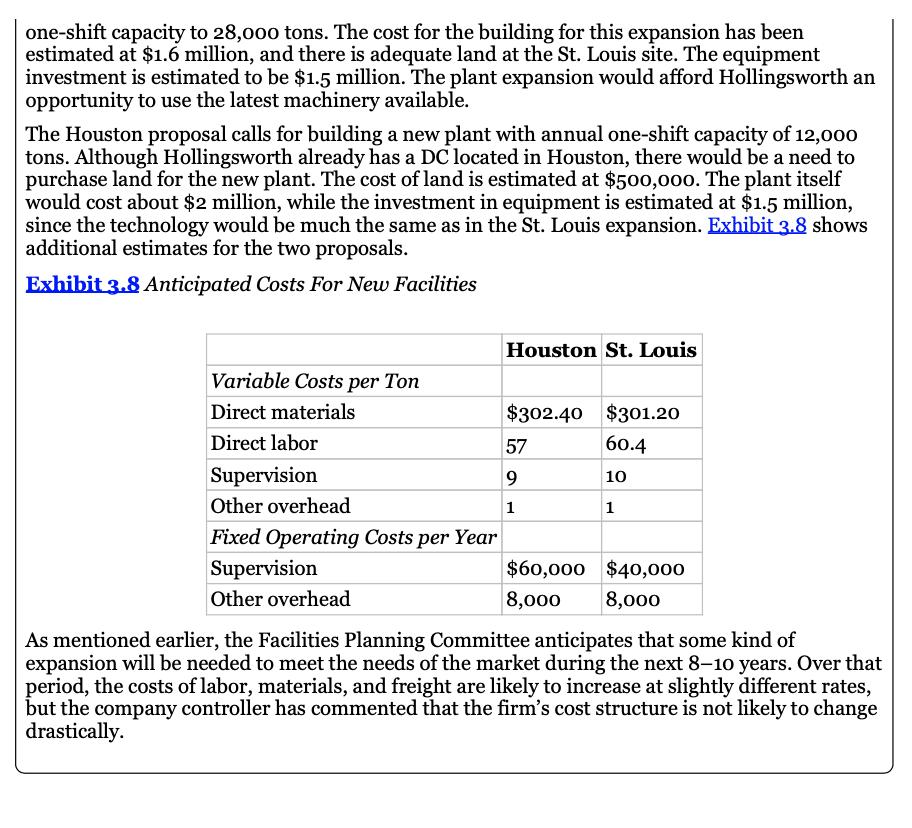
This assignment is a classical commodity distribution problem hat can be modelled using networks. It is described in the Case Study Case: Hollingsworth Paper Company at the end of chapter 3 of your textbook (pages 103-107). Preamble. Prior to answering the questions below, make sure to read carefully the (long) description of this problem, to organize the wealth of data that is provided and to get a good understanding of the context. Warning. This problem requires detailed written answers, typeset in ETEX. The answers must be supported by mathematical models and their solutions. The models will be imple- mented as spreadsheets, which will be submitted as part of your solutions. Note that some aspects of this problem, particularly related to capital costs, are not specified. You may have to make some assumptions. In that case, you should carefully explain what they are. Questions. 1. (5 marks) Briefly summarize the company's results for the previous year. Did it make a profit before considering depreciation and taxes? What about after depreciation, but before taxes? 2. (10 marks) In the scenario presented, each distribution centre is supplied from the nearest plant. Suppose that instead any plant could supply any distribution centre. Could the company have improved their profitability last year by reallocating produc- tion among plants, assuming that all plants remained operating? 3. (5 marks) Suppose there had also been an option to close the older Nashua plant. Was there a route to profitability by closing that plant and reallocating production between among the remaining plants? 4. (5 marks) Consider now the scenario of expanding the St. Louis plant. Explain the impact of this potential expansion using last year's data allowing any plant to supply any distribution centre, but keeping the Nashua plant open. 5. (5 marks) Consider now the scenario of opening plant in Houston. Explain the impact of this potential expansion using last year's data allowing any plant to supply any distribution centre, but keeping the Nashua plant open. 6. (10 marks) Prepare a one page memo charting a course of action for Hollingsworth Paper Company backed by solid mathematical reasoning. This may include exploring additional scenarios beyond those above. Case: Hollingsworth Paper Company The Hollingsworth Paper Company is an integrated manufacturer of paper products for markets throughout the United States. Its Container Division produces corrugated cardboard boxes at four plants and sells through six regional DCs. Last year's sales of nearly 60,000 tons accounted for revenues of almost $30 million. Exhibit 3.1 gives a regional breakdown of sales. Exhibit 3.1 Last Year's Sales By Geographic Region Northeast sales (Boston DC) 2,600 T .4% Northeast sales (Philadelphia DC) 9,700.T .16% Southeast sales (Atlanta DC) 15,500.T 26% Midwest sales (Chicago DC) 10,100 T 17% Southwest sales (Houston DC) 13,400.T 23% Far West sales (San Francisco DC) 7,500.T 13% 58,800 T 100% Cardboard containers are designed to meet a variety of customer needs. This variety reflects such features as size, shape, thickness, and type of closure. However, the technology is fairly simple and the competitors have the capability to manufacture the same products. To maintain its 10% share of the market, Hollingsworth emphasizes its quick and reliable delivery service. The firm has established its DCs to stock most of its standard items close to the major demand locations, but even specialty orders are processed through the DCs just to simplify paperwork. Because there are several firms in the industry and because few proprietary advantages exist, the market for cardboard boxes is quite competitive. The prices offered to the customer are virtually the same no matter where the product is made or what its delivery route. This means that the manufacturer absorbs its own freight costs. With price competition as strong as it is, Hollingsworth's freight costs are a critical part of the profit picture. Production and Distribution Facilities At present, Hollingsworth has four plants with one-shift capacities in the range of 12,000- 16,000 tons/year. At two of the four plants, production last year fell below one-shift capacity, while in the other two plants, a substantial amount of second-shift output was necessary. This pattern reflected the concentration of sales in the Midwest and South. Exhibit 3.2 provides details. Exhibit 3.2 Plant Capacities and Production Plant Nashua, NH Asheville, NC St. Louis, MO Portland, OR Total One-Shift Capacity Production % Utilization of One-Shift Capacity 14,000T .88 12,000 T 16,000 T 12,000.T 54,000.T 12,300.T 15,500.T 129 23,500.T 147 7,500.T .63 58,800.T 109 The plant located in Nashua, New Hampshire, is Hollingsworth's oldest facility. Its layout and equipment are somewhat outmoded; consequently, its productivity is relatively low. The Portland, Oregon, plant is the company's newest site, a workforce roughly one half the of Nashua's. Labor rates are cheapest at Asheville, North Carolina, and most expensive at St. Louis, Missouri. Variations in the process and wage rates, together with different utilizations, result in somewhat different costs at each location. An accounting summary of last year's operations revealed that costs per ton varied from a low of $397.61 at Portland to a high of $448.30 at Nashua. Exhibits 3.3-3.5 provide some additional detail on these cost figures. Exhibit 3.3 Total Costs (per Ton) Plant Nashua $439.80 Asheville 406.59 St. Louis 400.41 Portland 379.67 Exhibit 3.4 Plant Variable Costs (per Ton) Nashua 1st Shift $299.20 2nd 299.20 Shift Materials Labor Supervision Other Overhead Asheville 1st Shift 305.20 2nd 305.20 Shift Variable Cost Allocated Fixed Cost Total Cost St. Louis 1st Shift 301.20 2nd 301.20 Shift Portland 1st Shift 299.20 61.40 10.10 2nd 299.20 65.00 10.70 Shift Nashua 1st Shift $60,000 2nd Shift 30,000 $104.00 $19.60 110.80 20.80 Asheville 1st Shift 60,000 2nd Shift 30,000 St. Louis 76.00 13.00 81.00 13.60 9.11% of labor and supervision. Exhibit 3.5 Plant Fixed Costs 1st Shift 60,000 2nd Shift 30,000 74.60 12.40 78.80 13.10 $6600 3300 6600 3300 6600 3300 $8.50 10.32 8.08 17.95 Portland 1st Shift 60,000 2nd Shift 30,000 9.11% of labor and supervision. 6600 3300 $3.40 3.40 1.20 1.20 0.90 0.90 1.10 1.10 $8000 2000 8000 2000 Supervision Fringe Benefits Other Overhead Depreciation Total 8000 2000 $448.30 416.91 408.49 397.61 8000 2000 Fringe Benefits $13.60 14.48 9.79 10.41 9.57 10.11 7.87 8.33 $30,000 50,000 80,000 60,000 Total L $439.80 448.68 405.19 411.41 398.67 404.11 379.67 384.33 $104,600 35,300 124,600 35,300 154,600 35,300 134,600 35,300 Patterns of Distribution Facing a competitive market with tight margins, Hollingsworth has paid particular attention to its freight costs. For a number of years, its policy has been to supply each DC from the nearest plant, thus minimizing the freight component of cost. Exhibit 3.6 lists last year's freight rates. Exhibit 3.6 Last Year's Transportation Rates Per Ton From Boston Philadelphia Atlanta Chicago Houston San Francisco Nashua $16.00 $20.00 $64.00 $56.00 $72.00 20.00 56.00 56.00 56.00 20.00 Asheville 52.00 48.00 St. Louis 56.00 52.00 Portland 112.00 112.00 Houston 64.00 60.00 104.00 64.00 48.00 30.00 0.00 To Atlanta Chicago Houston Boston $500.00 $448.30 Philadelphia 500.00 448.30 500.00 416.91 San Francisco Under this company policy, the Nashua plant supplies the Boston and Philadelphia DCs, Asheville supplies the Atlanta DC, St. Louis supplies the Chicago and Houston DCs, and Portland supplies the San Francisco DC. This pattern results in very different profits in the various regions, ranging from around $40 per ton in Chicago to a slight loss in Philadelphia. The DC managers, whose annual bonus partly reflects the profits made in their region, have complained about this system for years. Exhibit 3.7 summarizes last year's records. Exhibit 3.7 Last Year's Profits Per Ton Selling Cost of Price Goods Sold 500.00 408.49 500.00 408.49 500.00 397.61 Includes a 4% sales commission. 32.00 68.00 Warehousing Selling anda Admin. Exp. $32.00 32.00 29.00 31.00 30.00 32.00 $104.00 88.00 72.00 36.00 76.00 Freight Net Profits Absorbed before Taxes $16.00 20.00 20.00 20.00 32.00 36.00 $3.70 (0.30) 34.09 40.51 29.51 34.39 Expansion Proposals Over the years Hollingsworth has made investments to improve its productive capacity in several places. As sales in the Midwest grew, the St. Louis plant was expanded. New equipment was installed in Asheville to keep pace with sales growth in the South. Based on these experiences, the engineering staff was eventually able to design the new Portland plant, which reduced the cost of meeting demand in the West. Few improvements, however, have been implemented at Nashua. The two-story layout hampers innovation, and the engineers have expressed some concern about whether the old building is strong enough to support some of the heavier pieces of machinery now used elsewhere. As a continuation of these investment initiatives, the Facilities Planning Committee at Hollingsworth has produced two large-scale expansion plans to help meet predicted sales growth over the next 8-10 years. One proposal involves a large addition to the St. Louis plant, while the second proposal involves construction of a new plant in Houston. The St. Louis proposal calls for an expansion of the existing plant sufficient to raise its annual one-shift capacity to 28,000 tons. The cost for the building for this expansion has been estimated at $1.6 million, and there is adequate land at the St. Louis site. The equipment investment is estimated to be $1.5 million. The plant expansion would afford Hollingsworth an opportunity to use the latest machinery available. The Houston proposal calls for building a new plant with annual one-shift capacity of 12,000 tons. Although Hollingsworth already has a DC located in Houston, there would be a need to purchase land for the new plant. The cost of land is estimated at $500,000. The plant itself would cost about $2 million, while the investment in equipment is estimated at $1.5 million, since the technology would be much the same as in the St. Louis expansion. Exhibit 3.8 shows additional estimates for the two proposals. Exhibit 3.8 Anticipated Costs For New Facilities Variable Costs per Ton Direct materials Direct labor Houston St. Louis $302.40 57 9 1 $301.20 60.4 10 1 Supervision Other overhead Fixed Operating Costs per Year Supervision Other overhead As mentioned earlier, the Facilities Planning Committee anticipates that some kind of expansion will be needed to meet the needs of the market during the next 8-10 years. Over that period, the costs of labor, materials, and freight are likely to increase at slightly different rates, but the company controller has commented that the firm's cost structure is not likely to change drastically. $60,000 8,000 $40,000 8,000
Step by Step Solution
3.41 Rating (148 Votes )
There are 3 Steps involved in it

Get step-by-step solutions from verified subject matter experts