

Question: This assignment is designed to familiarize students with completing the necessary work for a research report and to produce that report. To receive a good
This assignment is designed to familiarize students with completing the necessary work for a research report and to produce that report. To receive a good grade on these papers, you should include the following in your report. In addition, please review the syllabus for the requirements written papers. Your grade will also be partially determined by grammar, formatting, etc. The entire paper should use APA formatting.
Documents, including a description of the sample and SPSS information about statistical analyses are included. You are not required to perform any statistical analyses, but you will be expected to interpret the SPSS printout information.
This is a learning experience, not an exam. So, please do not be afraid to ask any questions you may have. Good luck!
I. Title Page
II. Table of Contents
III. Executive Summary
IV. Background
A. Literature Review (use at least five (5) references, other than the ones given as references for the concepts)
B. Statement of Hypotheses
V. Methodology
A. Sample Consumers
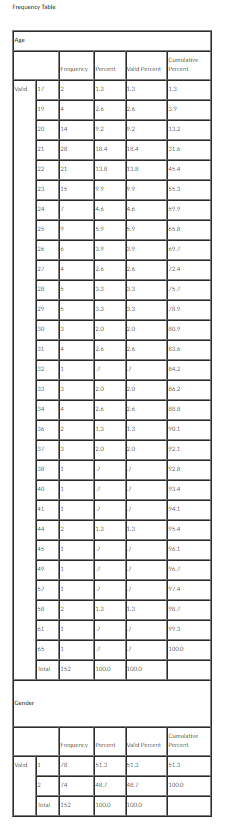
1. Who are these consumers, in terms of ages and gender?
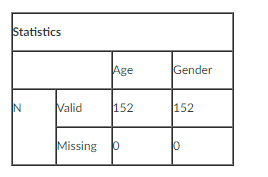
2. How many are in the sample?
B. Data Collection How was the data collected?
C. Measures Used
1. Reliability Analysis of Scales
2. Scale Reduction Resulting from Reliability Analysis
D. Statistical Analysis What statistics were used?
VI. Findings
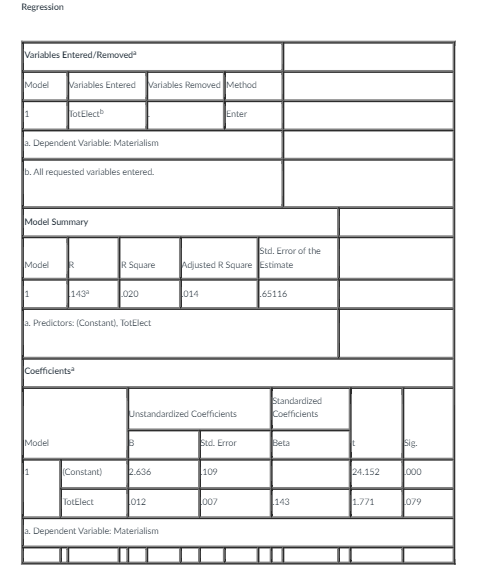
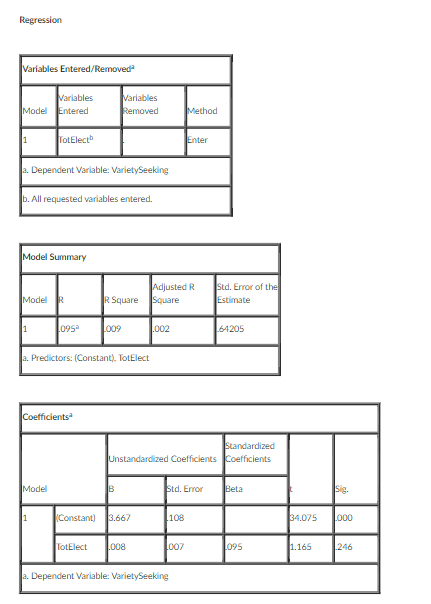
A. Do the findings support the hypotheses? Regression.
B. R2.
VII. Recommendations and Conclusions
VIII. Appendices (if needed)
Information for Analysis
Concepts and Definitions
1. Electronics Usage The number of hours a person spends on all electronic devices in a day. Independent Variable.
2. Materialism The degree to which consumers believe that the number and quality of a persons possessions are an indicator of their success in life (Mick, 1996; Netemeyer et al., 1995; Richins, 1994; Richins and Dawson, 1992; Rindfleisch et al., 1997). Dependent Variable 1.
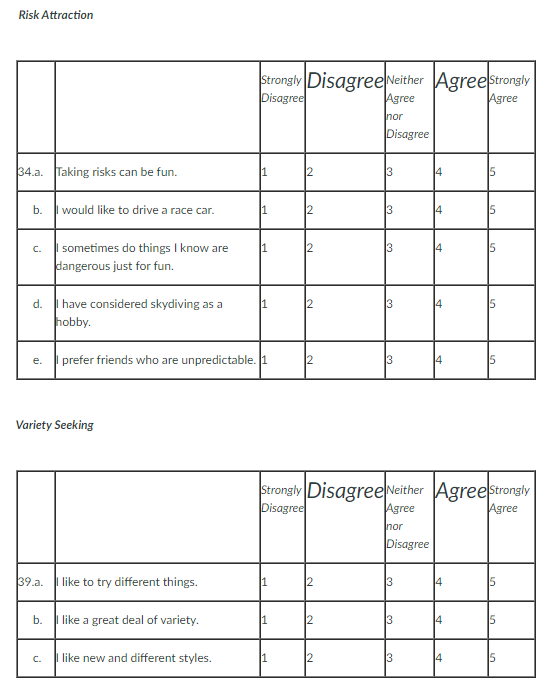
3. Risk Attraction The extent to which a consumer is willing to seek out or engage in risky activities (Griffin et al., 1996; Zuckerman, 1971). Dependent Variable 2.
4. Variety Seeking The degree to which a consumer expresses a desire to try new and different things (Donthu and Gilliland, 1996). Dependent Variable
Information about Sample and Data Collection
In order to assess the impact of electronics usage on consumer risky behavior, data was collected from consumers in marketing classes at three major universities. Extra credit was offered for students in these classes to complete a questionnaire. Additional extra credit was then offered for each student to find two additional people who were not current university or college students to complete the questionnaire. This snowball sampling method was used to get both a portion of the sample who are young adults in college and a portion of the sample who have a chance to be older consumers in a different stage of life.
Statistics
Regression was used for testing the hypotheses. Use a significance of p
Measures from the Questionnaire
Age
1. How old are you? __________
Gender
2. What is your birth gender: Male Female (Females were coded as 1 and Males as 2)
Electronics Usage
3. a. Below are four activities for which electronic devices are used. For each activity, write in how much time you spend each day on the activity. Please state the time in terms of hours. For example, you might spend 2.5 hours on an activity, so you would write that number in the space provided.
________ Homework
________ Gaming
________ Texting
________ Talking on Phone
3. b. Below are four more activities for which electronic devices are used. Follow the same instructions as 8a above to fill in the spaces provided.
________ Internet Searches
________ Internet Dating Sites
________ Shopping/Product Searches
________ Pornography
3. c. Below are the last four activities for which electronic devices are used. Follow the same instructions as 8a above to fill in the spaces provided.
________ Internet Surfing
________ Listening to Music
________ Social Networking
________ Other (Please Specify) ____________________________________________
________ Total (Sum of all the above)
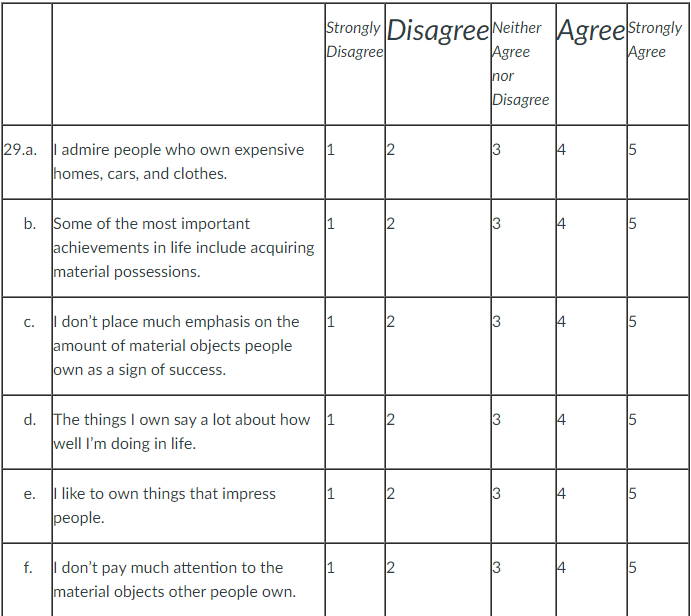
\begin{tabular}{|c|c|c|c|c|c|c|} \hline & & \begin{tabular}{l} Strongly \\ Disagree \end{tabular} & Disagree & \begin{tabular}{l} Neither \\ Agree \\ nor \\ Disagree \end{tabular} & Agree & \begin{tabular}{l} Strongly \\ Agree \end{tabular} \\ \hline 29.a. & \begin{tabular}{l} I admire people who own expensive \\ homes, cars, and clothes. \end{tabular} & 1 & 2 & 3 & 4 & 5 \\ \hline b. & \begin{tabular}{l} Some of the most important \\ achievements in life include acquiring \\ material possessions. \end{tabular} & 1 & 2 & 3 & 4 & 5 \\ \hline c. & \begin{tabular}{l} I don't place much emphasis on the \\ amount of material objects people \\ own as a sign of success. \end{tabular} & 1 & 2 & 3 & 4 & 5 \\ \hline d. & \begin{tabular}{l} The things I own say a lot about how \\ well I'm doing in life. \end{tabular} & 1 & 2 & 3 & 4 & 5 \\ \hline e. & \begin{tabular}{l} l like to own things that impress \\ people. \end{tabular} & 1 & 2 & 3 & 4 & 5 \\ \hline f. & \begin{tabular}{l} I don't pay much attention to the \\ material objects other people own. \end{tabular} & 1 & 2 & 3 & 4 & 5 \\ \hline \end{tabular} Risk Attraction Variety Seeking \begin{tabular}{|l|l|l|l|} \hline \multicolumn{2}{|l|}{ Statistics } \\ \hline \multicolumn{2}{|l|}{} & Age & Gender \\ \hline \multicolumn{2}{|l|}{} & Age & \\ \hline & Valid & 152 & 152 \\ \cline { 2 - 4 } & Missing & 0 & 0 \\ \hline \end{tabular} fre-_-... veli- Regression Regression
Step by Step Solution
There are 3 Steps involved in it

Get step-by-step solutions from verified subject matter experts