Question: This assignment is optional and is worth 10 bonus points. In this assignment you'll formulate Patty's Portfolio Planning Problem (given below) in an Excel worksheet
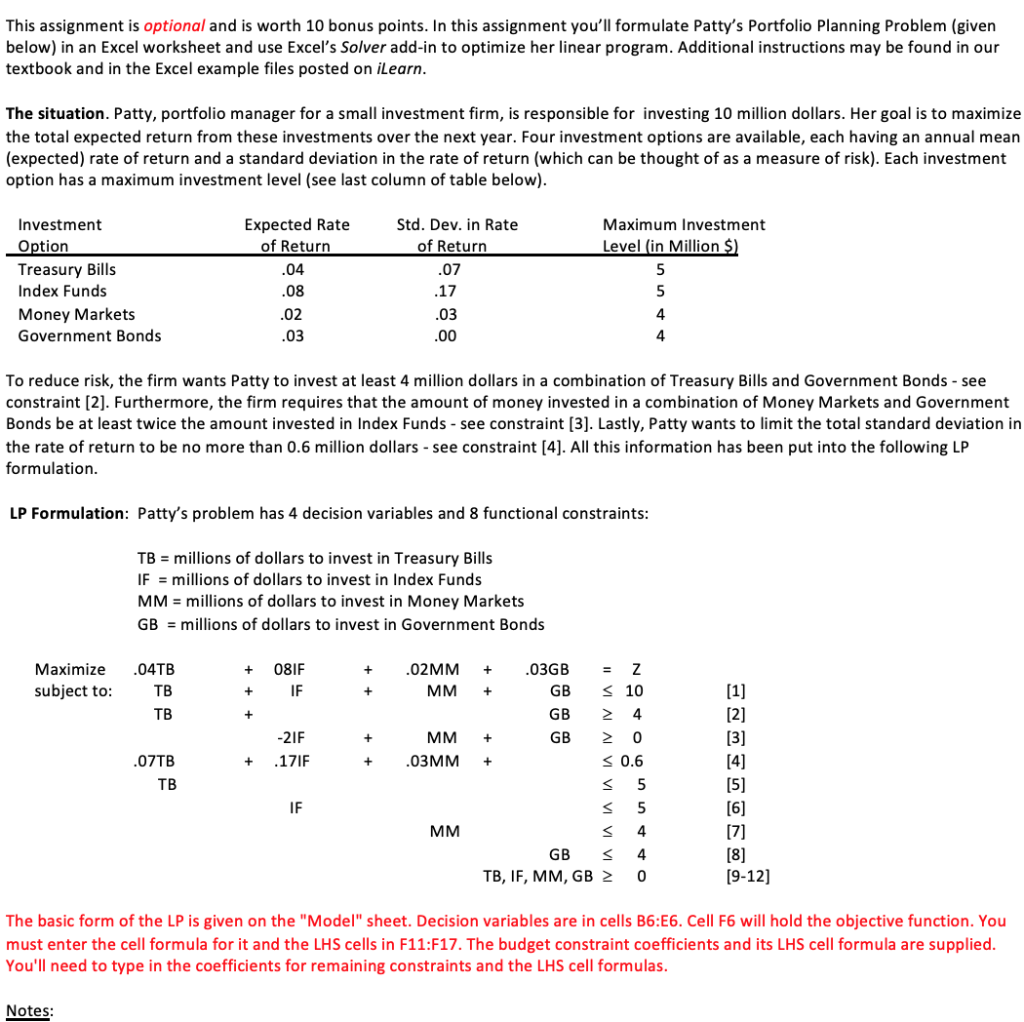
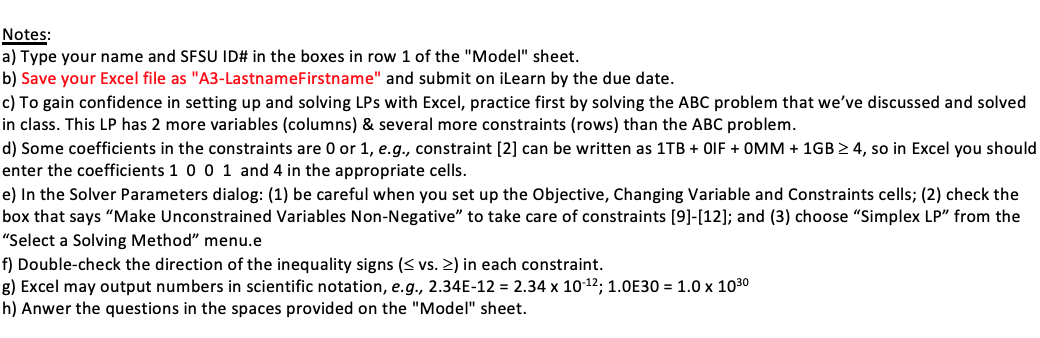
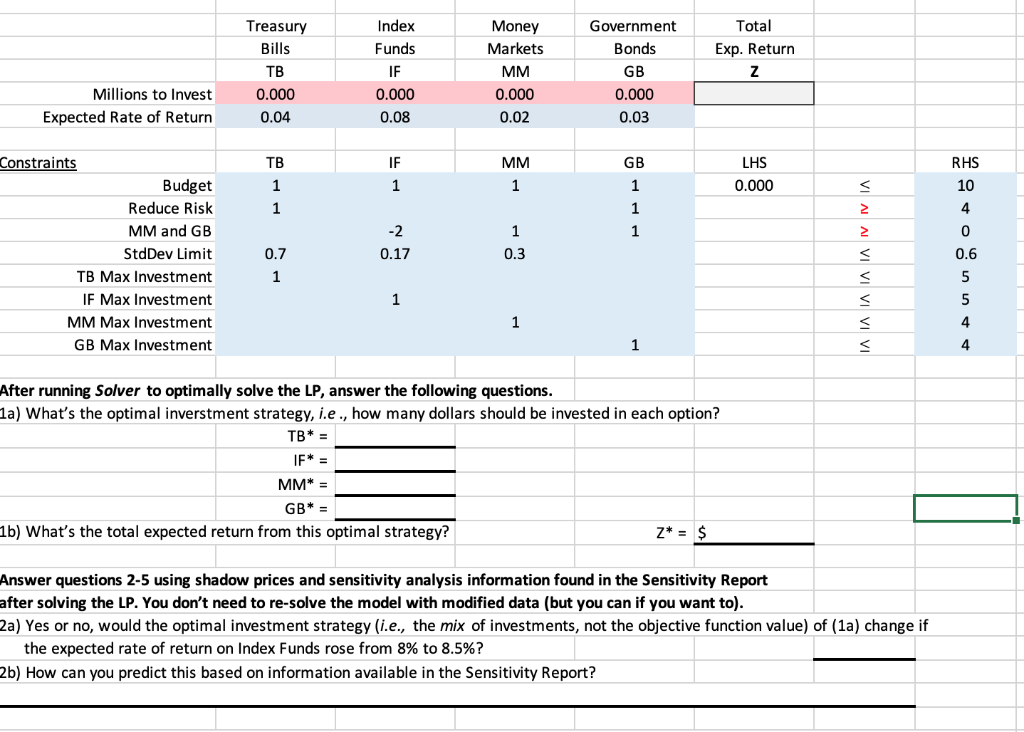
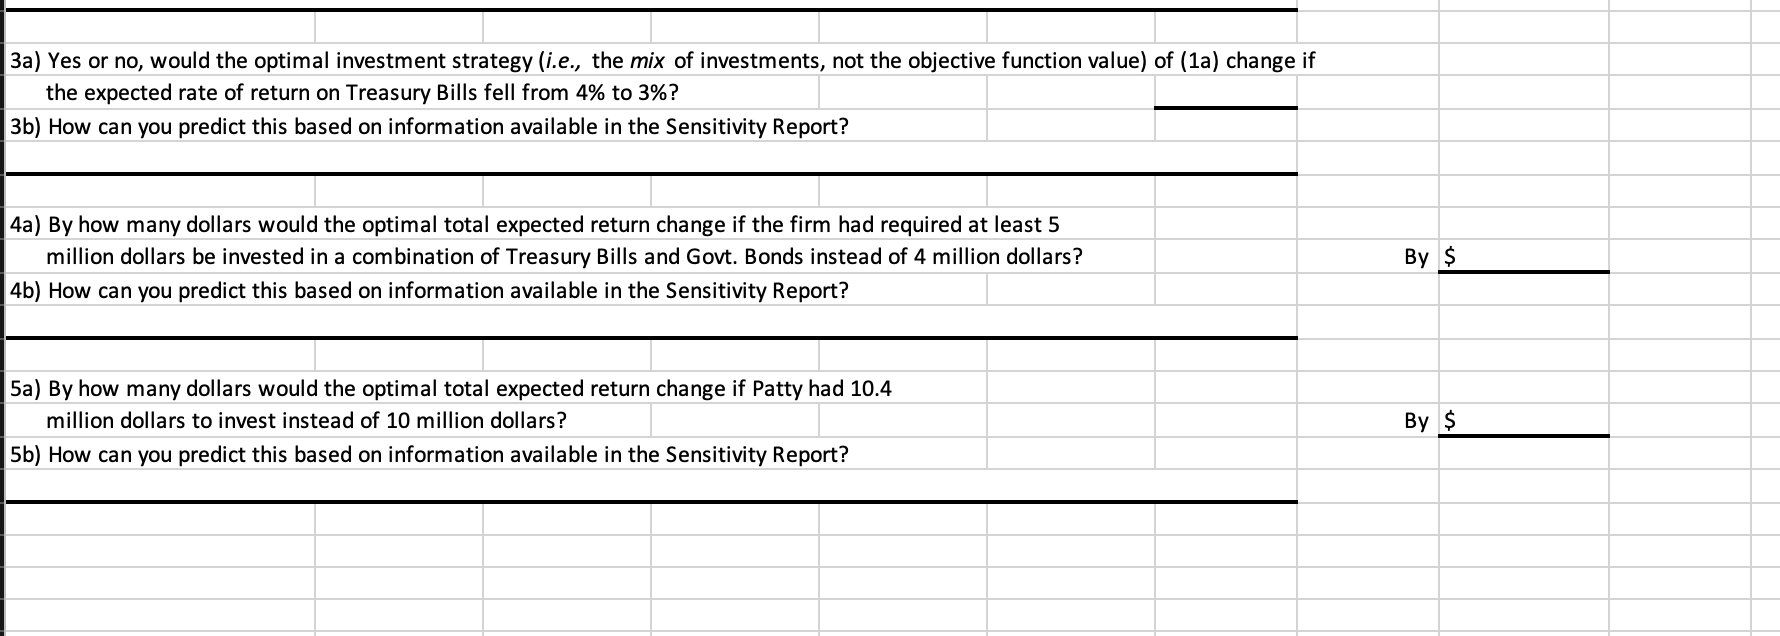
This assignment is optional and is worth 10 bonus points. In this assignment you'll formulate Patty's Portfolio Planning Problem (given below) in an Excel worksheet and use Excel's Solver add-in to optimize her linear program. Additional instructions may be found in our textbook and in the Excel example files posted on iLearn. The situation. Patty, portfolio manager for a small investment firm, is responsible for investing 10 million dollars. Her goal is to maximize the total expected return from these investments over the next year. Four investment options are available, each having an annual mean (expected) rate of return and a standard deviation in the rate of return (which can be thought of as a measure of risk). Each investment option has a maximum investment level (see last column of table below). To reduce risk, the firm wants Patty to invest at least 4 million dollars in a combination of Treasury Bills and Government Bonds - see constraint [2]. Furthermore, the firm requires that the amount of money invested in a combination of Money Markets and Government Bonds be at least twice the amount invested in Index Funds - see constraint [3]. Lastly, Patty wants to limit the total standard deviation in the rate of return to be no more than 0.6 million dollars - see constraint [4]. All this information has been put into the following LP formulation. LP Formulation: Patty's problem has 4 decision variables and 8 functional constraints: The basic form of the LP is given on the "Model" sheet. Decision variables are in cells B6:E6. Cell F6 will hold the objective function. You must enter the cell formula for it and the LHS cells in F11:F17. The budget constraint coefficients and its LHS cell formula are supplied. You'll need to type in the coefficients for remaining constraints and the LHS cell formulas. Notes: a) Type your name and SFSU ID# in the boxes in row 1 of the "Model" sheet. b) Save your Excel file as "A3-LastnameFirstname" and submit on iLearn by the due date. c) To gain confidence in setting up and solving LPs with Excel, practice first by solving the ABC problem that we've discussed and solved in class. This LP has 2 more variables (columns) \& several more constraints (rows) than the ABC problem. d) Some coefficients in the constraints are 0 or 1, e.g., constraint [2] can be written as 1TB+0 OIF +0MM+1GB4, so in Excel you should enter the coefficients 1001 and 4 in the appropriate cells. e) In the Solver Parameters dialog: (1) be careful when you set up the Objective, Changing Variable and Constraints cells; (2) check the box that says "Make Unconstrained Variables Non-Negative" to take care of constraints [9]-[12]; and (3) choose "Simplex LP" from the "Select a Solving Method" menu.e f) Double-check the direction of the inequality signs (vs. ) in each constraint. g) Excel may output numbers in scientific notation, e.g., 2.34E12=2.341012;1.0E30=1.01030 h) Anwer the questions in the spaces provided on the "Model" sheet. After running Solver to optimally solve the LP, answer the following questions. 1a) What's the optimal inverstment strategy, i.e., how many dollars should be invested in each option? \begin{tabular}{r|r} TB & = \\ IF & = \\ MM & = \\ GB & = \\ \hline \end{tabular} Z=$ 1b) What's the total expected return from this optimal strategy? Answer questions 2-5 using shadow prices and sensitivity analysis information found in the Sensitivity Report after solving the LP. You don't need to re-solve the model with modified data (but you can if you want to). 2a) Yes or no, would the optimal investment strategy (i.e., the mix of investments, not the objective function value) of (1a) change if the expected rate of return on Index Funds rose from 8% to 8.5% ? 2b) How can you predict this based on information available in the Sensitivity Report? 3a) Yes or no, would the optimal investment strategy (i.e., the mix of investments, not the objective function value) of (1a) change if the expected rate of return on Treasury Bills fell from 4% to 3% ? 3b) How can you predict this based on information available in the Sensitivity Report? \begin{tabular}{l} \hline 4a) By how many dollars would the optimal total expected return change if the firm had required at least 5 \\ million dollars be invested in a combination of Treasury Bills and Govt. Bonds instead of 4 million dollars? \\ \hline 4b) How can you predict this based on information available in the Sensitivity Report? \\ \hline 5a) By how many dollars would the optimal total expected return change if Patty had 10.4 \\ \hline million dollars to invest instead of 10 million dollars? \\ \hline \end{tabular} 5b) How can you predict this based on information available in the Sensitivity Report


