

Question: This assignment requires the using financial statements, the profit and loss (P&L) statement and the balance sheet, to determine an organization's financial performance. As you
This assignment requires the using financial statements, the profit and loss (P&L) statement and the balance sheet, to determine an organization's financial performance. As you have learned, financial performance is determined by analyzing ratios that pertain to profitability, asset and debt utilization, and liquidity.
You will be analyzing profitability, asset and debt utilization, and liquidity ratios for a fictional company, the Soft Temple Coffeeshop. The completed P&L and Balance Sheets for the years 2011 and 2012 are provided.
p1
p2
p3
p4
p5
p6
p7
p8
p9
p10
1. Compute the profitability, asset and debt utilization, and liquidity ratios for 2011 and 2012. There are ten ratios to compute.
2. For each ratio, identify which is better. In other words, determine the year that had the better performance.
3. Provide an explanation of what may have caused the change. For example, if the profit margin increased from one year to the next, give a reason that might have caused the increase.
4. Show all math work used. Use neat writing or type in the answers. Thank you
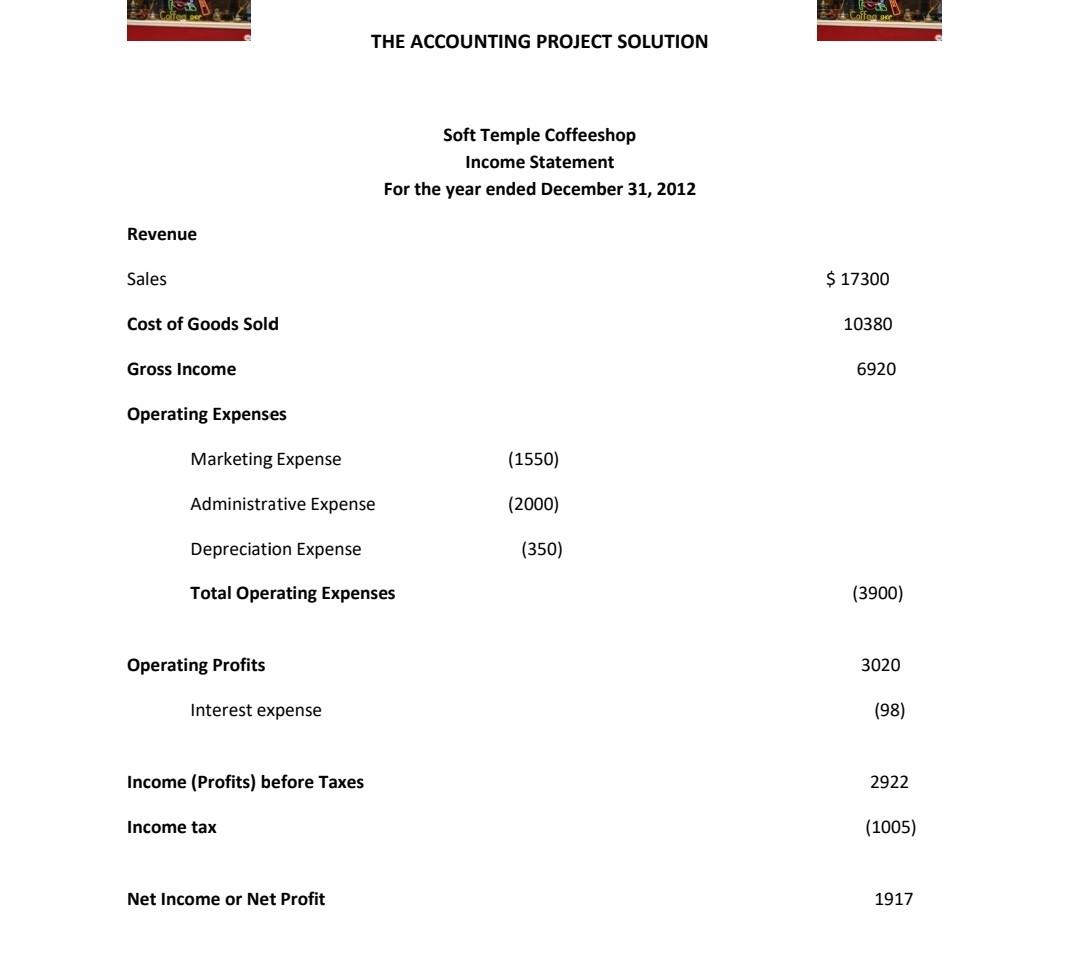
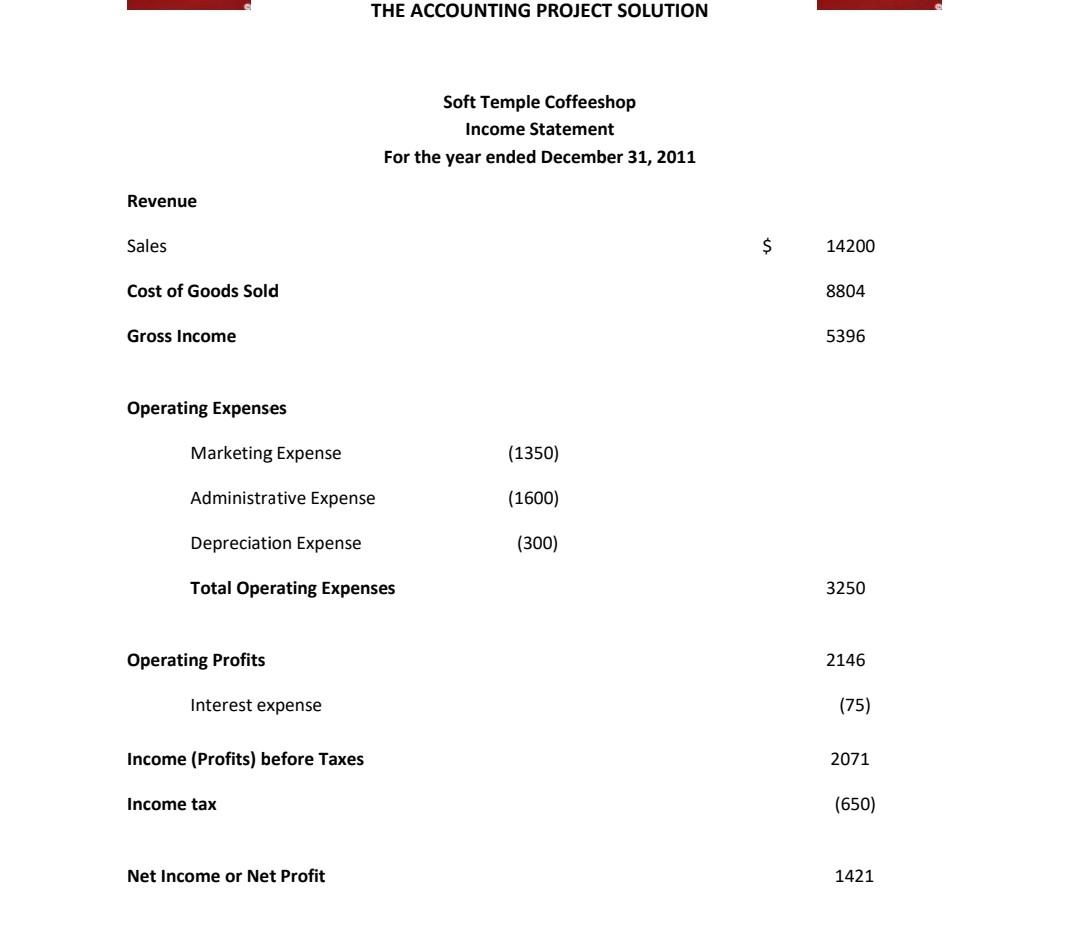
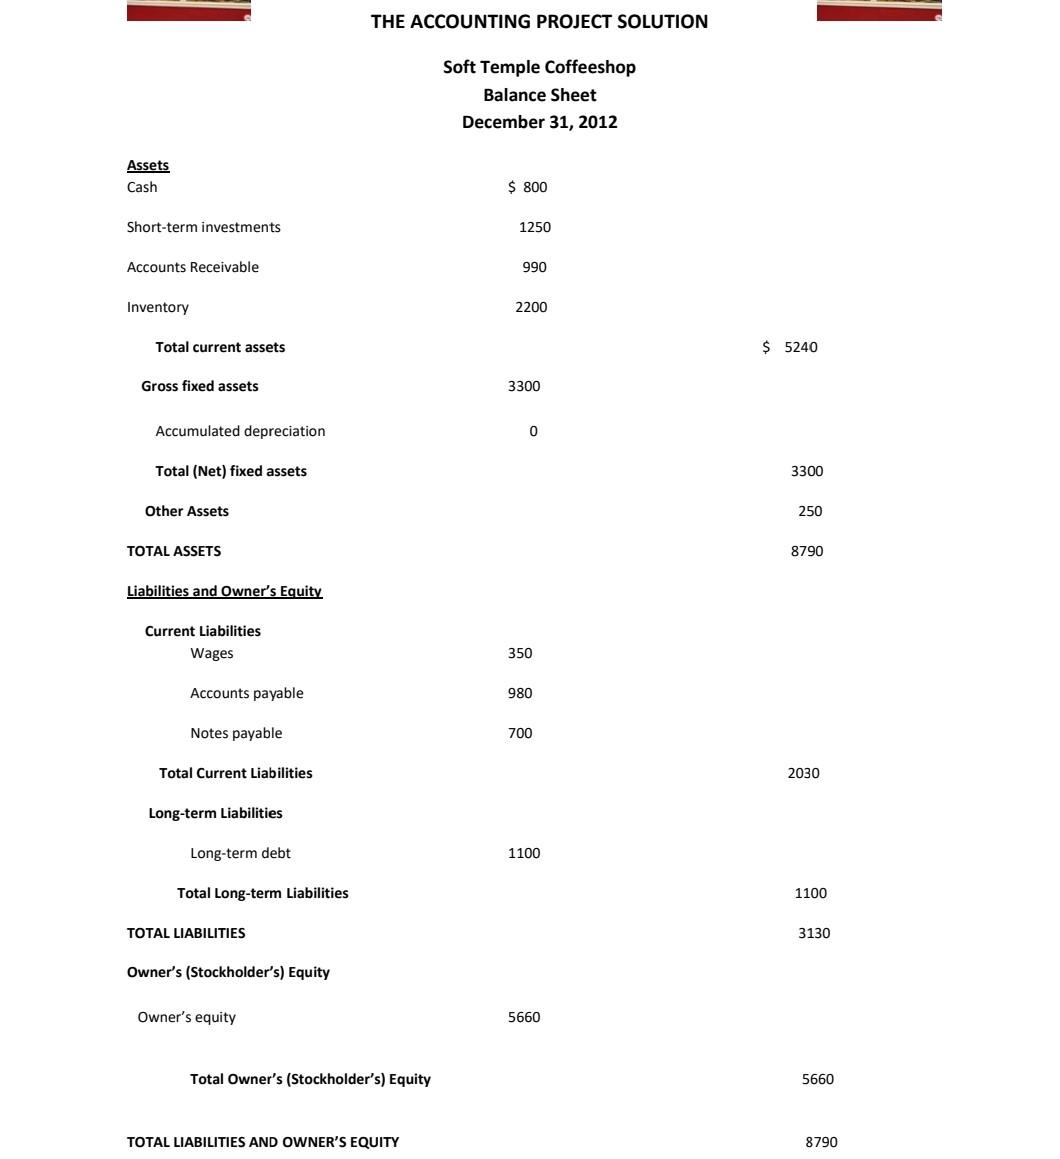
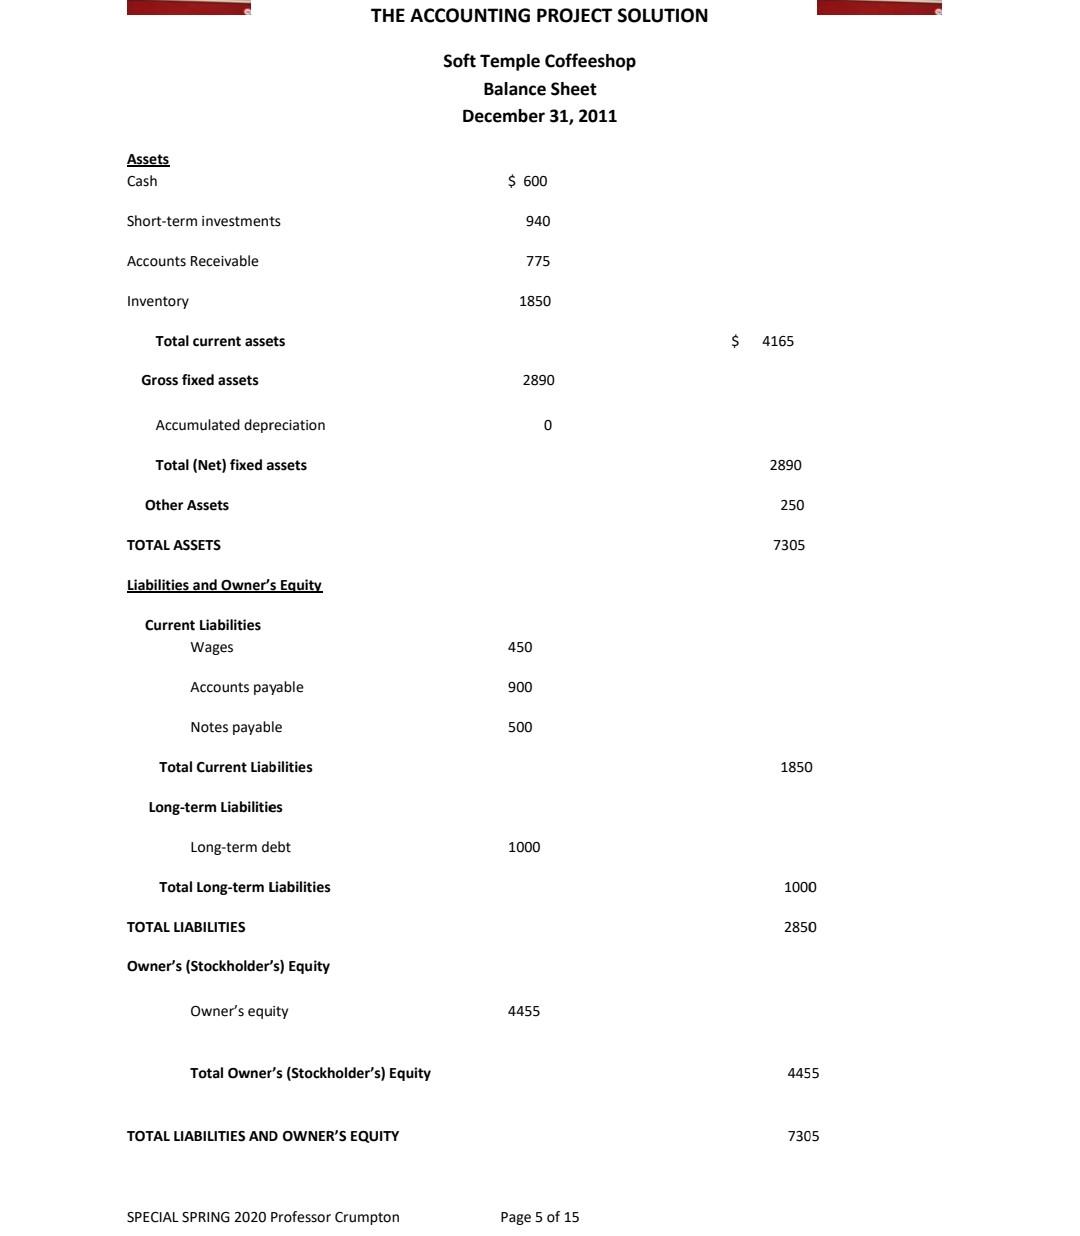
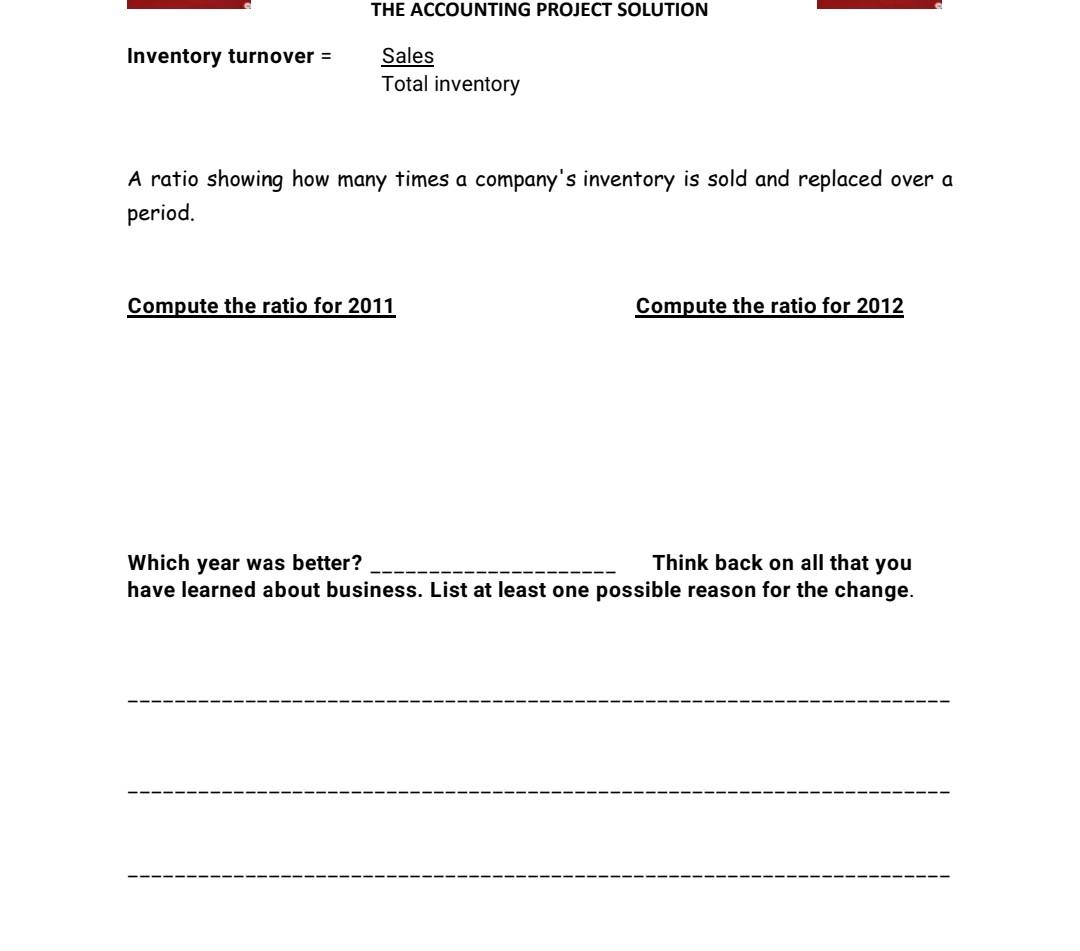
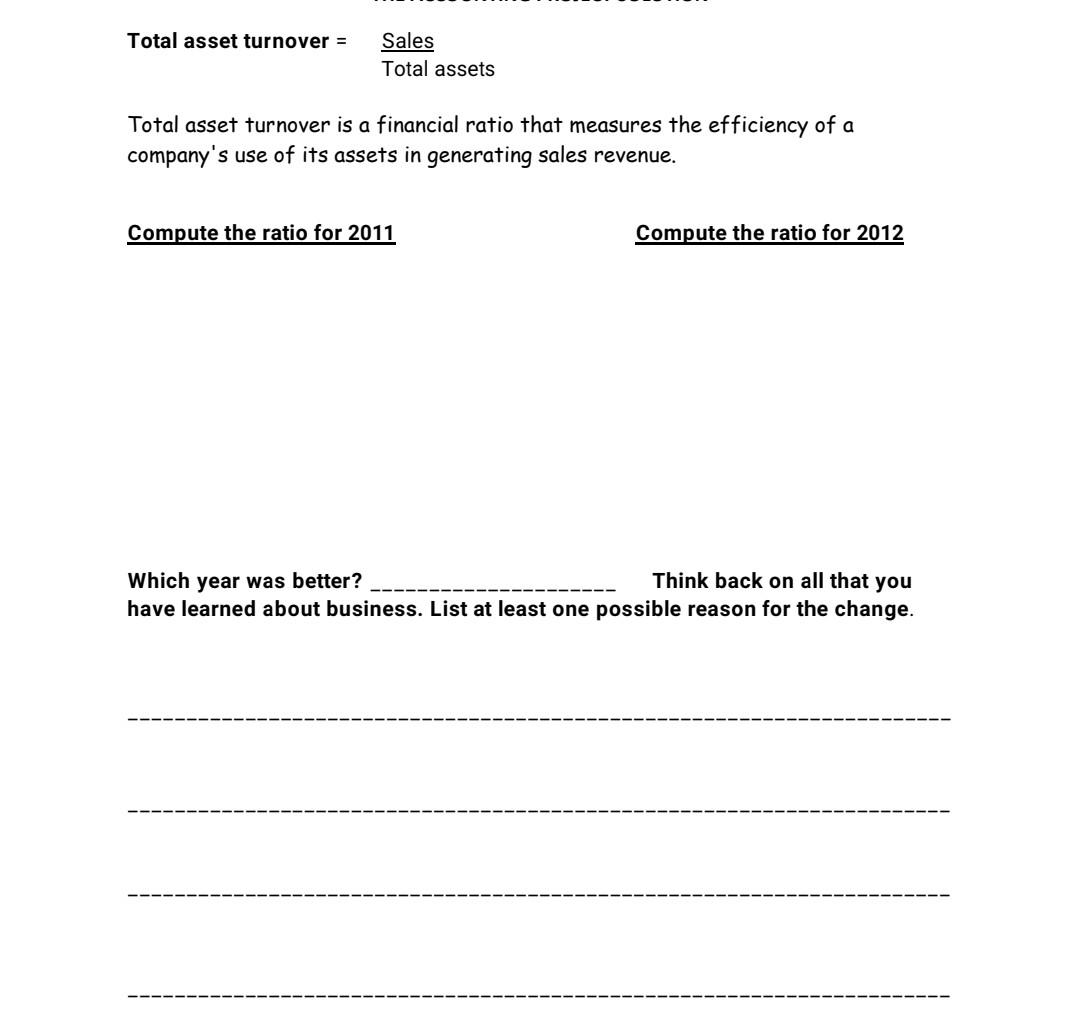
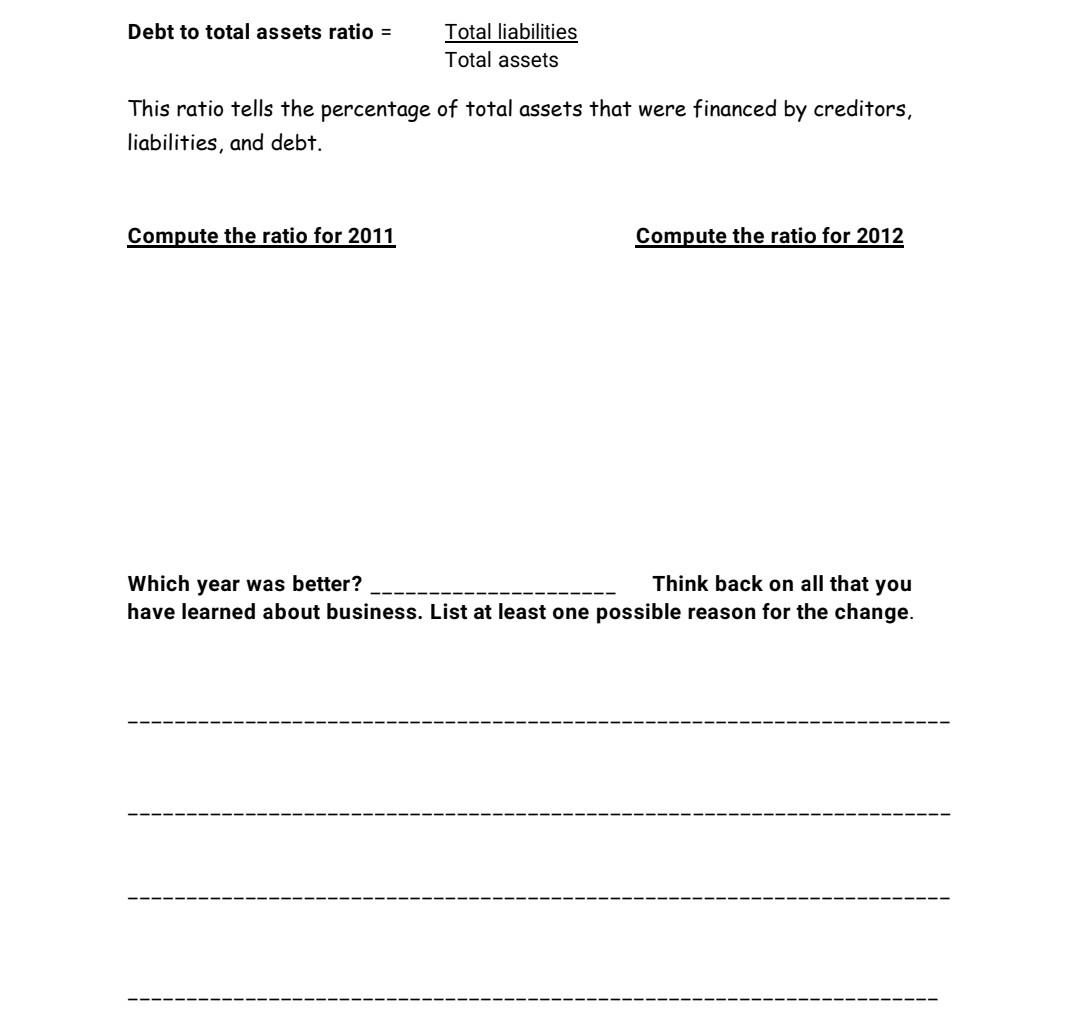
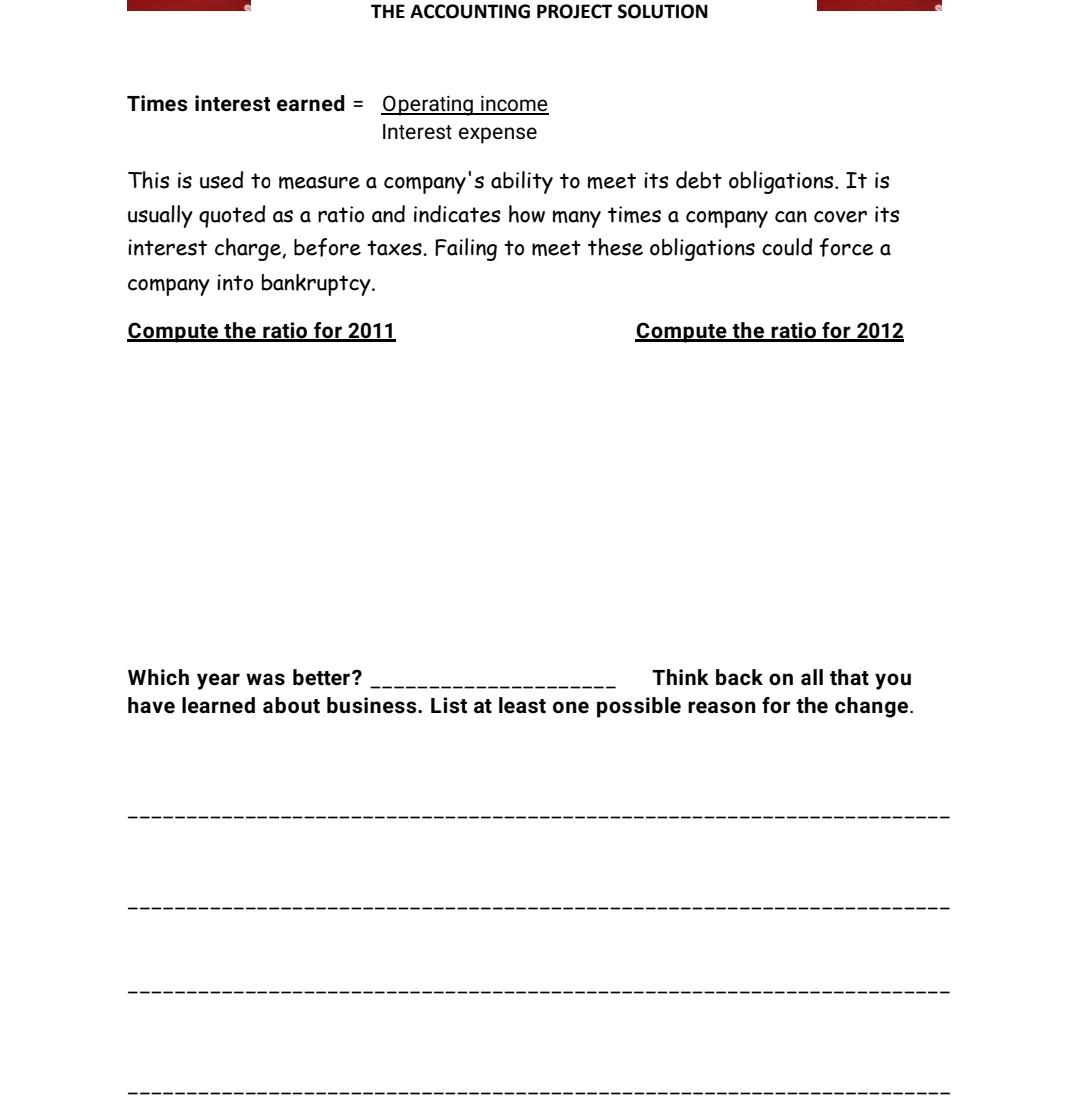
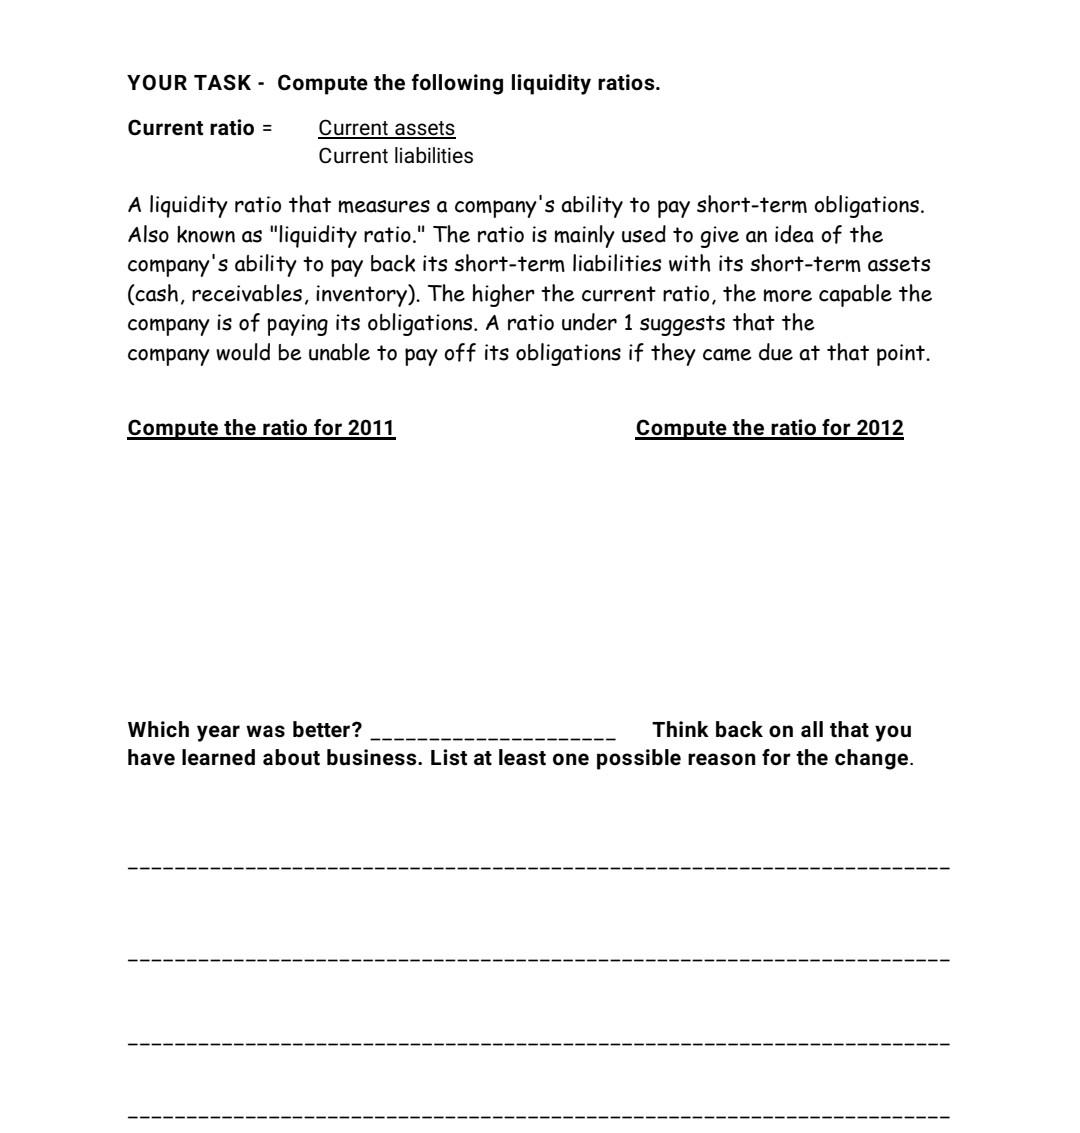
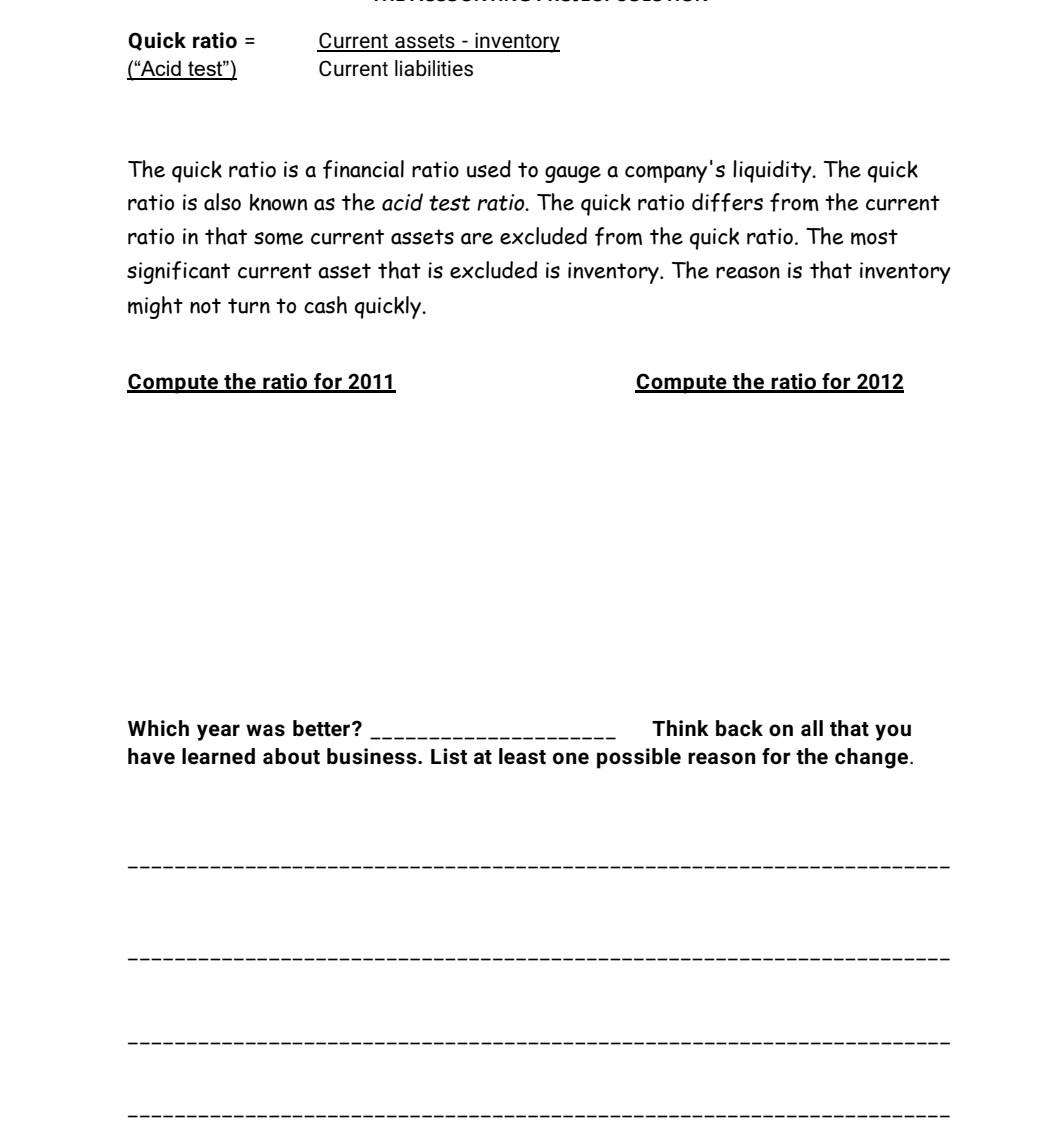
THE ACCOUNTING PROJECT SOLUTION Soft Temple Coffeeshop Income Statement For the year ended December 31, 2012 Revenue Sales $ 17300 Cost of Goods Sold 10380 Gross Income 6920 Operating Expenses Marketing Expense (1550) Administrative Expense (2000) Depreciation Expense (350) Total Operating Expenses (3900) Operating Profits 3020 Interest expense (98) Income (Profits) before Taxes 2922 Income tax (1005) Net Income or Net Profit 1917 THE ACCOUNTING PROJECT SOLUTION Soft Temple Coffeeshop Income Statement For the year ended December 31, 2011 Revenue Sales $ 14200 Cost of Goods Sold 8804 Gross Income 5396 Operating Expenses Marketing Expense (1350) Administrative Expense (1600) Depreciation Expense (300) Total Operating Expenses 3250 Operating Profits 2146 Interest expense (75) Income (Profits) before Taxes 2071 Income tax (650) Net Income or Net Profit 1421 THE ACCOUNTING PROJECT SOLUTION Soft Temple Coffeeshop Balance Sheet December 31, 2012 Assets Cash $ 800 Short-term investments 1250 Accounts Receivable 990 Inventory 2200 Total current assets $ 5240 Gross fixed assets 3300 Accumulated depreciation 0 Total (Net) fixed assets 3300 Other Assets 250 TOTAL ASSETS 8790 Liabilities and Owner's Equity Current Liabilities Wages 350 Accounts payable 980 Notes payable 700 Total Current Liabilities 2030 Long-term Liabilities Long-term debt 1100 Total Long-term Liabilities 1100 TOTAL LIABILITIES 3130 Owner's (Stockholder's) Equity Owner's equity 5660 Total Owner's (Stockholder's) Equity 5660 TOTAL LIABILITIES AND OWNER'S EQUITY 8790 THE ACCOUNTING PROJECT SOLUTION Soft Temple Coffeeshop Balance Sheet December 31, 2011 Assets Cash $ 600 Short-term investments 940 Accounts Receivable 775 Inventory 1850 Total current assets $ 4165 Gross fixed assets 2890 Accumulated depreciation 0 Total (Net) fixed assets 2890 Other Assets 250 TOTAL ASSETS 7305 Liabilities and Owner's Equity Current Liabilities Wages 450 Accounts payable 900 Notes payable 500 Total Current Liabilities 1850 Long-term Liabilities Long-term debt 1000 Total Long-term Liabilities 1000 TOTAL LIABILITIES 2850 Owner's (Stockholder's) Equity Owner's equity 4455 Total Owner's (Stockholder's) Equity 4455 TOTAL LIABILITIES AND OWNER'S EQUITY 7305 SPECIAL SPRING 2020 Professor Crumpton Page 5 of 15 The Soft Temple Coffeeshop Ratio Analysis "Interpreting the Numbers. What information do they tell? Profit margin = Net income Sales Profit margin (sometimes called return on sales) measures how much out of every dollar of sales a company actually keeps in earnings. Compute the ratio for 2011 Compute the ratio for 2012 Which year was better? Think back on all that you have learned about business. List at least one possible reason for the change. THE ACCOUNTING PROJECT SOLUTION Return on assets = Net income Assets Return on assets ratio (ROA) shows how profitable a company's assets are in generating revenue. Compute the ratio for 2011 Compute the ratio for 2012 Which year was better? Think back on all that you have learned about business. List at least one possible reason for the change. THE ACCOUNTING PROJECT SOLUTION Return on equity = Net income Owner's Equity Return on equity measures a corporation's profitability by revealing how much profit a company generates with the money shareholders have invested. Compute the ratio for 2011 Compute the ratio for 2012 Which year was better? Think back on all that you have learned about business. List at least one possible reason for the change. THE ACC UNTING PROJECT SO YOUR TASK - Compute the following asset utilization ratios. Receivables turnover = Sales Accounts receivable Accounts receivable turnover ratio indicates how many times the accounts receivable have been collected during an accounting period. It can be used to determine if a company is having difficulties collecting sales made on credit. The higher the turnover, the faster the business is collecting its receivables. Compute the ratio for 2011 Compute the ratio for 2012 Which year was better? Think back on all that you have learned about business. List at least one possible reason for the change. THE ACCOUNTING PROJECT SOLUTION Inventory turnover = Sales Total inventory A ratio showing how many times a company's inventory is sold and replaced over a period. Compute the ratio for 2011 Compute the ratio for 2012 Which year was better? Think back on all that you have learned about business. List at least one possible reason for the change. Total asset turnover = Sales Total assets Total asset turnover is a financial ratio that measures the efficiency of a company's use of its assets in generating sales revenue. Compute the ratio for 2011 Compute the ratio for 2012 Which year was better? Think back on all that you have learned about business. List at least one possible reason for the change. Debt to total assets ratio = Total liabilities Total assets This ratio tells the percentage of total assets that were financed by creditors, liabilities, and debt. Compute the ratio for 2011 Compute the ratio for 2012 Which year was better? Think back on all that you have learned about business. List at least one possible reason for the change. THE ACCOUNTING PROJECT SOLUTION Times interest earned = Operating income Interest expense This is used to measure a company's ability to meet its debt obligations. It is usually quoted as a ratio and indicates how many times a company can cover its interest charge, before taxes. Failing to meet these obligations could force a company into bankruptcy. Compute the ratio for 2011 Compute the ratio for 2012 Which year was better? Think back on all that you have learned about business. List at least one possible reason for the change. YOUR TASK - Compute the following liquidity ratios. Current ratio = Current assets Current liabilities A liquidity ratio that measures a company's ability to pay short-term obligations. Also known as "liquidity ratio." The ratio is mainly used to give an idea of the company's ability to pay back its short-term liabilities with its short-term assets (cash, receivables, inventory). The higher the current ratio, the more capable the company is of paying its obligations. A ratio under 1 suggests that the company would be unable to pay off its obligations if they came due at that point. Compute the ratio for 2011 Compute the ratio for 2012 Which year was better? Think back on all that you have learned about business. List at least one possible reason for the change. Quick ratio = ("Acid test") Current assets - inventory Current liabilities The quick ratio is a financial ratio used to gauge a company's liquidity. The quick ratio is also known as the acid test ratio. The quick ratio differs from the current ratio in that some current assets are excluded from the quick ratio. The most significant current asset that is excluded is inventory. The reason is that inventory might not turn to cash quickly. Compute the ratio for 2011 Compute the ratio for 2012 Which year was better? Think back on all that you have learned about business. List at least one possible reason for the change
Step by Step Solution
There are 3 Steps involved in it

Get step-by-step solutions from verified subject matter experts