

Question: This assignment should be completed using Notebook and Excel. You are expected to show code, results and insert notes/the questions being answered. Part 1: Data
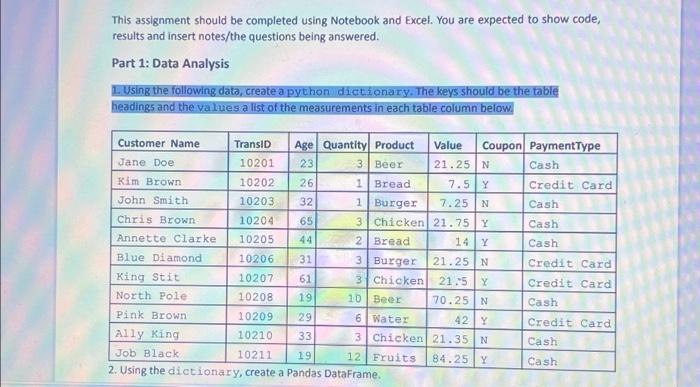
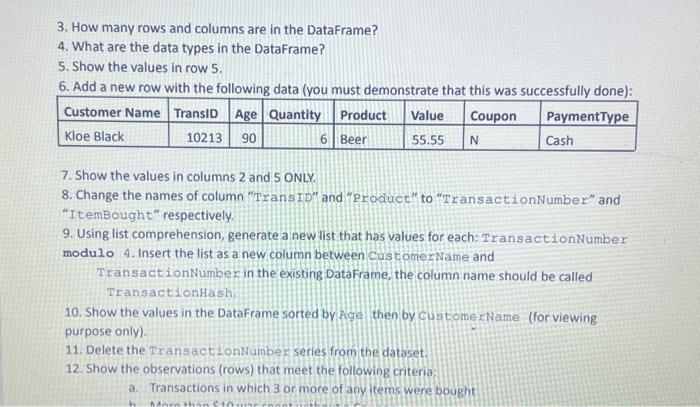
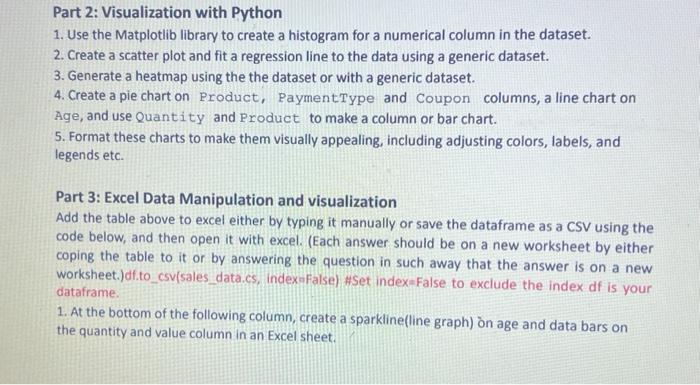
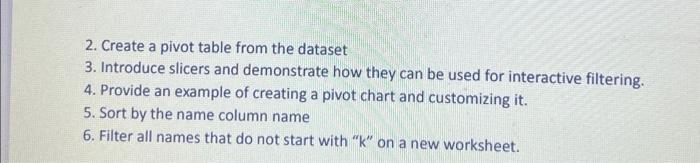
This assignment should be completed using Notebook and Excel. You are expected to show code, results and insert notes/the questions being answered. Part 1: Data Analysis E. Using the following dats, create a python dict fonary. The keys should be the table headings and the values a list of the measurements in each table column below. 3. How many rows and columns are in the DataFrame? 4. What are the data types in the DataFrame? 5. Show the values in row 5 . 6. Add a new row with the following data (you must demonstrate that this was successfullv done): 7. Show the values in columns 2 and 5 ONLY. 8. Change the names of column "Trans ID" and "Product" to "TransactionNumber" and "ItemBought" respectively. 9. Using list comprehension, generate a new list that has values for each: Transact ionNumber modulo 4. Insert the list as a new column between CustomerName and TransactionNumber in the existing DataFrame, the column name should be called TransactionHash: 10. Show the values in the DataFrame sorted by fige then by custome rName (for viewing purpose only). 11. Delete the TransactionNumber series from the dataset. 12. Show the observations (rows) that meet the following criteria: a. Transactions in which 3 or more of any items were bought Part 2: Visualization with Python 1. Use the Matplotlib library to create a histogram for a numerical column in the dataset. 2. Create a scatter plot and fit a regression line to the data using a generic dataset. 3. Generate a heatmap using the the dataset or with a generic dataset. 4. Create a pie chart on Product, PaymentType and Coupon columns, a line chart on Age, and use Quantity and Product to make a column or bar chart. 5. Format these charts to make them visually appealing, including adjusting colors, labels, and legends etc. Part 3: Excel Data Manipulation and visualization Add the table above to excel either by typing it manually or save the dataframe as a CSV using the code below, and then open it with excel. (Each answer should be on a new worksheet by either coping the table to it or by answering the question in such away that the answer is on a new worksheet.)df.to_csv(sales_data.cs, indexaFalse) \#Set index=False to exclude the index df is your dataframe. 1. At the bottom of the following column, create a sparkline(line graph) on age and data bars on the quantity and value column in an Excel sheet. 2. Create a pivot table from the dataset 3. Introduce slicers and demonstrate how they can be used for interactive filtering. 4. Provide an example of creating a pivot chart and customizing it. 5. Sort by the name column name 6. Filter all names that do not start with " k " on a new worksheet
Step by Step Solution
There are 3 Steps involved in it

Get step-by-step solutions from verified subject matter experts