

Question: This bar chart is visual representations of the pricing methods for Level 1 securities. (Level 1 in Fair value Hierarchy) Question Response What do these
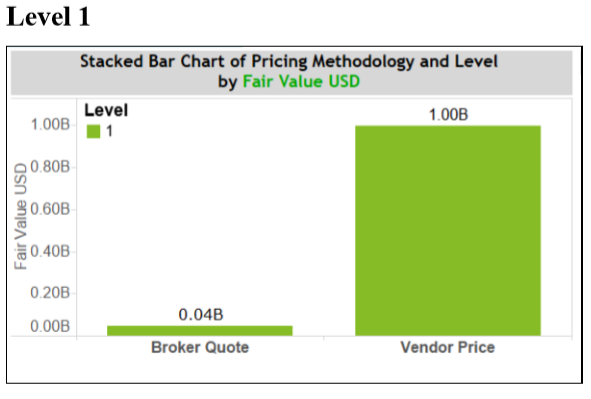
This bar chart is visual representations of the pricing methods for Level 1 securities. (Level 1 in Fair value Hierarchy)
| Question | Response |
| What do these visualizations show? | |
| How might these observations affect our risk assessment? |
Level 1 Stacked Bar Chart of Pricing Methodology and Level by Fair Value USD Level 1.00B 1 1.00B 0.80B Fair Value USD 90.60B 0.40B 0.20B 0.04B 0.00B Broker Quote Vendor Price Level 1 Stacked Bar Chart of Pricing Methodology and Level by Fair Value USD Level 1.00B 1 1.00B 0.80B Fair Value USD 90.60B 0.40B 0.20B 0.04B 0.00B Broker Quote Vendor Price
Step by Step Solution
There are 3 Steps involved in it
1 Expert Approved Answer
Step: 1 Unlock

Question Has Been Solved by an Expert!
Get step-by-step solutions from verified subject matter experts
Step: 2 Unlock
Step: 3 Unlock