

Question: This box plot graphic below shows the comparison of eight group of people for computer vision test score. Which group has the lowest score? Which
This box plot graphic below shows the comparison of eight group of people for computer vision test score.
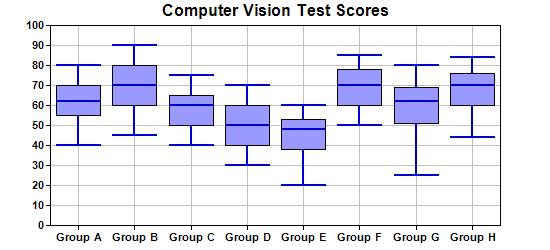
- Which group has the lowest score?
- Which group has the highest score?
- Which group has the highest median?
- Which group has the lowest 25th percentile?
- Which group has the highest 75th percentile?
Question 2
The life of an automotive battery is normally distributed with mean 900 days and standard deviation 35 days. What fraction of these batteries would be expected to survive beyond 1,000 days?
Question 3
The time to failure in hours of an electronic component subjected to an accelerated life test is shown in the following table. To accelerate the failure test, the units were tested at an elevated temperature (read down, then across).
Electronic Component Failure Time | |||
127 | 124 | 121 | 118 |
125 | 123 | 136 | 131 |
131 | 120 | 140 | 125 |
124 | 119 | 137 | 133 |
129 | 128 | 125 | 141 |
121 | 133 | 124 | 125 |
142 | 137 | 128 | 140 |
151 | 124 | 129 | 131 |
160 | 142 | 130 | 129 |
125 | 123 | 122 | 126 |
(a) Calculate the sample average and standard deviation.
(b) Construct a histogram.
(c) Construct a stem-and-leaf plot.
(d) Find the sample median and the lower and upper quartiles.
Question 4
(a) Consider the following data taken on subgroups of size 5. The data contains 20 averages and ranges on the diameter (in millimeters) of an important component part of an engine. Display Xbar and R-charts. Does the process appear to be in control? (Do not use 3 sigma to construct the charts. Instead use the Factors For Control Charts provided in Lectures 3 and 4).
Sample | Xbar | R |
1 | 2.3972 | 0.0052 |
2 | 2.4191 | 0.0117 |
3 | 2.4215 | 0.0062 |
4 | 2.3917 | 0.0089 |
5 | 2.4151 | 0.0095 |
6 | 2.4027 | 0.0101 |
7 | 2.3921 | 0.0091 |
8 | 2.4171 | 0.0059 |
9 | 2.3951 | 0.0068 |
10 | 2.4215 | 0.0048 |
11 | 2.3887 | 0.0082 |
12 | 2.4107 | 0.0032 |
13 | 2.4009 | 0.0077 |
14 | 2.3992 | 0.0107 |
15 | 2.3889 | 0.0025 |
16 | 2.4107 | 0.0138 |
17 | 2.4109 | 0.0037 |
18 | 2.3944 | 0.0052 |
19 | 2.3951 | 0.0038 |
20 | 2.4015 | 0.0017 |
(b) Suppose that the buyer has set specifications for the part. The specifications require that the diameter fall in the range covered by 2.40000 ± 0.0100 mm. What proportion of units produced by this process will not conform to specifications?
Question 5
Briefly discuss the relationship between Average Run Length (ARL) and Type I (a – alpha) and Type II (b– Beta) errors relative to the control chart. What practical implication in terms of process operation do these two types of errors have? (Requires research, please cite all your work).
100- 90- 80- 70- 60- 50 40- 30 20- 10- 0 Computer Vision Test Scores Group A Group B Group C Group D Group E Group F Group G Group H
Step by Step Solution
3.48 Rating (158 Votes )
There are 3 Steps involved in it
Based on the given box plot graphic 1 Group H has the lowest score 2 Group E has the highest score 3 Group C has the highest median 4 Group A has the lowest 25th percentile 5 Group G has the highest 7... View full answer

Get step-by-step solutions from verified subject matter experts