

Question: This boxplot shows the distribution of ages for a class of 20 students. Why is there no line in the box to indicate the median
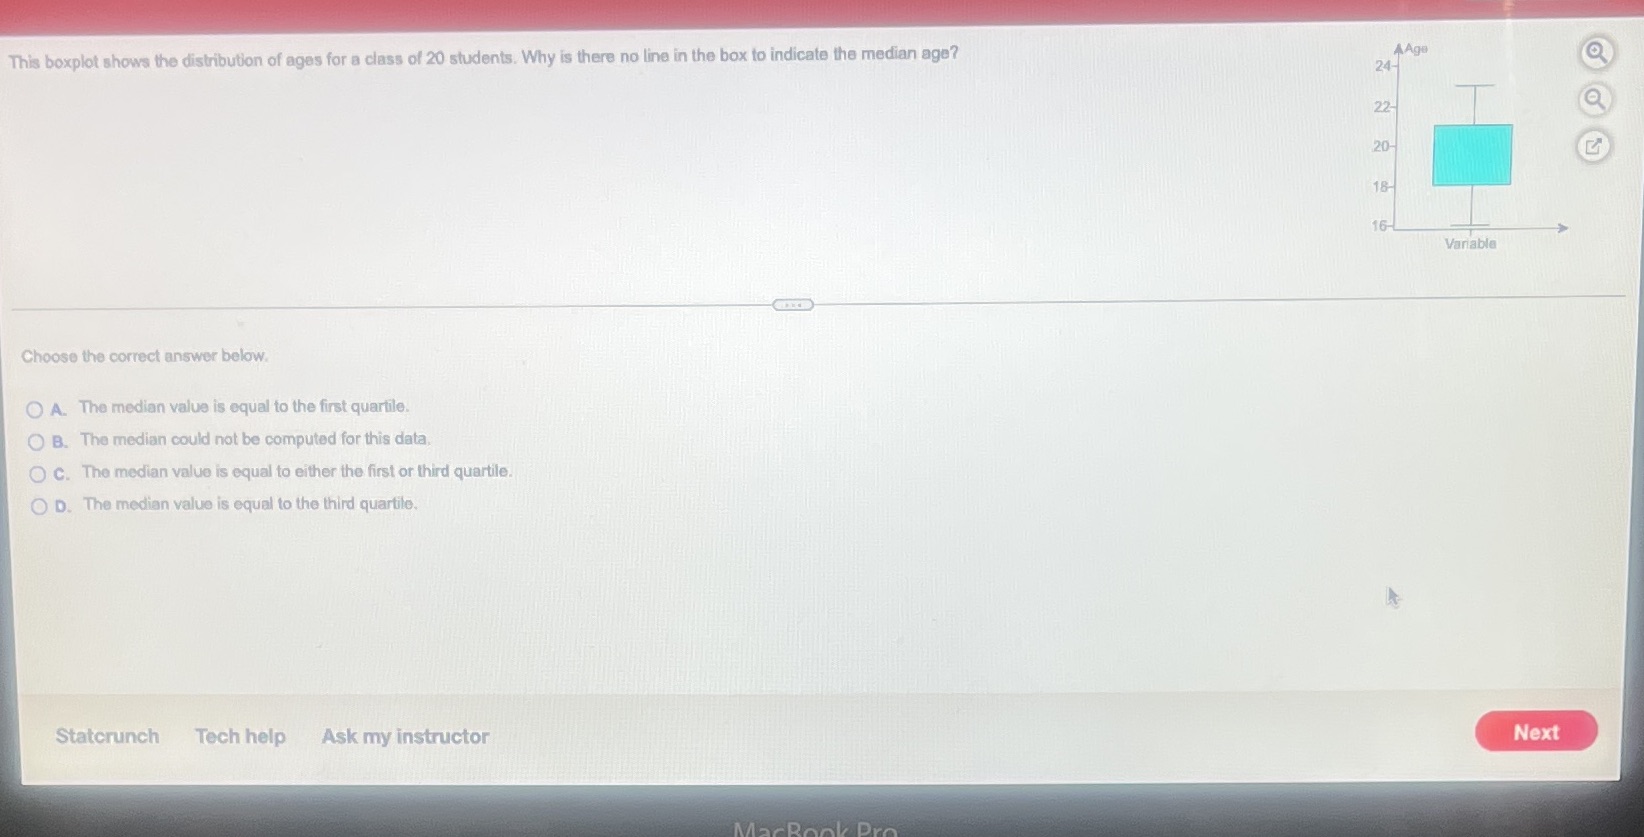

This boxplot shows the distribution of ages for a class of 20 students. Why is there no line in the box to indicate the median age? AAge 24- 22- 20 18- 16- Variable Choose the correct answer below. O A. The median value is equal to the first quartile. O B. The median could not be computed for this data O C. The median value is equal to either the first or third quartile. O D. The median value is equal to the third quartile. Statcrunch Tech help Ask my instructor Next D
Step by Step Solution
There are 3 Steps involved in it
1 Expert Approved Answer
Step: 1 Unlock

Question Has Been Solved by an Expert!
Get step-by-step solutions from verified subject matter experts
Step: 2 Unlock
Step: 3 Unlock