

Question: This case is about evaluating inventory options and network options for a scientific glass manufacturer and distributor. The company uses a periodic review inventory control
This case is about evaluating inventory options and network options for a scientific glass manufacturer and distributor. The company uses a periodic review inventory control process. For purposes of this assignment, you will work primarily with the two representative products whose characteristics are shown in Exhibit Your first task is to determine how much (inventory) costs will increase if Scientific Glass chooses to implement (and achieve) a 99% service level vs. the optimal service level that overage and underage costs dictate. To do that, you need to think about:
A) The average lot size that will drive each products cycle stock
B) The uncertainty as measured by standard deviation of demand over review time and lead time for each product. Note that you have to have safety stock to cover the uncertainty over the combined times.
C) Combining inventory costs associated with both cycle stock and safety stock. (Hint: Think back to EOQ, which only deals with cycle stock).
PLEASE SHOW ALL FORUMULAS, STEPS, WORK, EXPLANATIONS, AND CALCULATIONS.
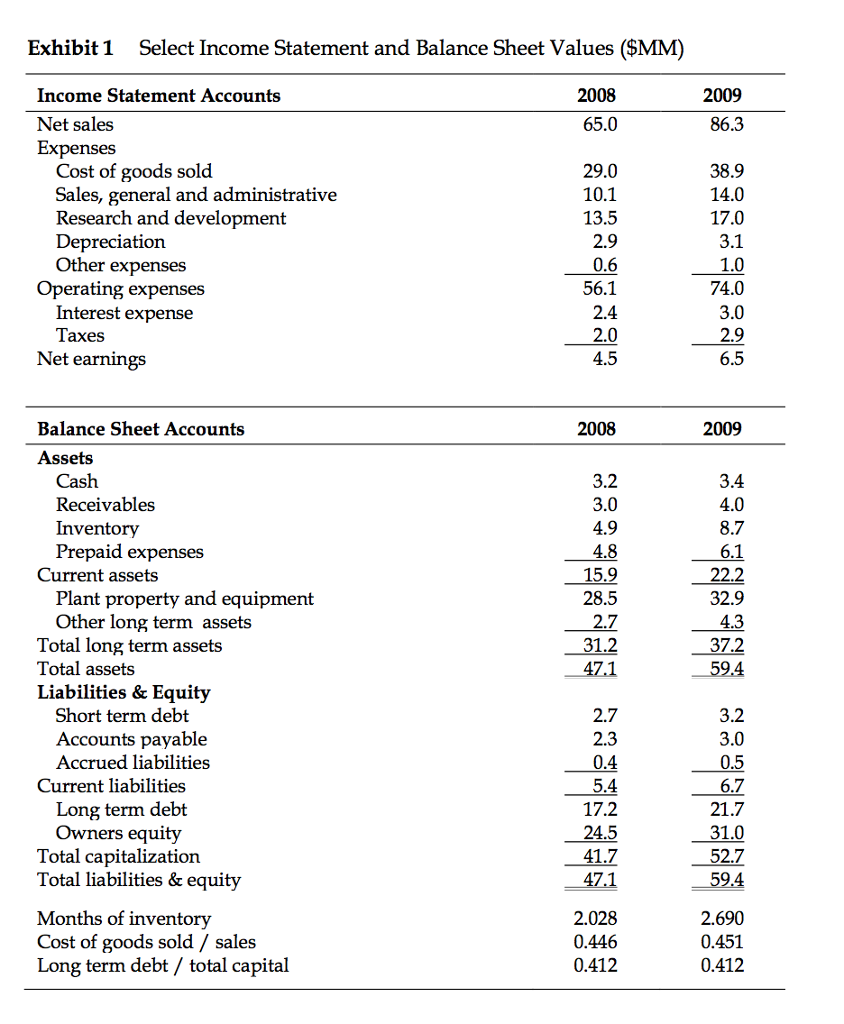
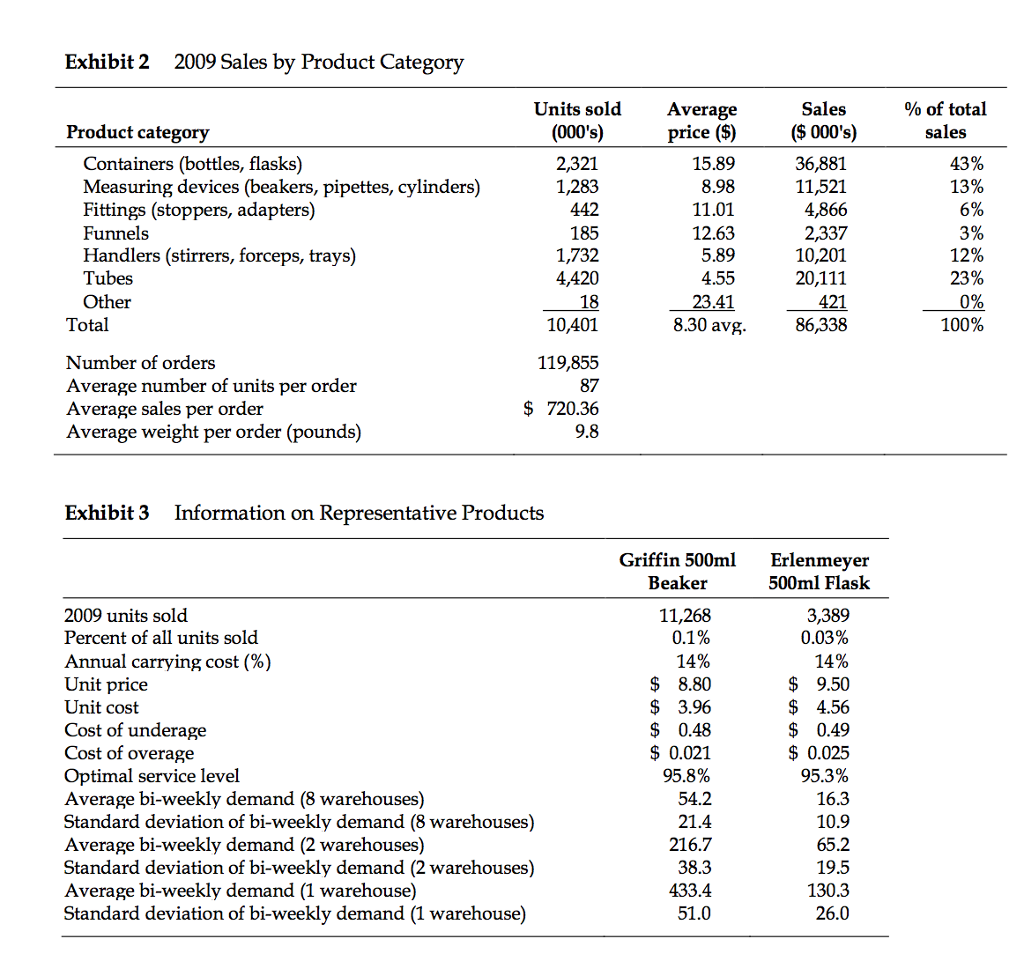
Exhibit 1 Select Income Statement and Balance Sheet Values (SMM) 2009 Income Statement Accounts 2008 Net sales 65.0 86.3 Expenses Cost of goods sold 29.0 38.9 Sales, general and administrative 10.1 14.0 Research and development 13.5 17.0 Depreciation 2.9 3.1 other expenses 0.6 1.0 74.0 Operating expenses 56.1 Interest expense 2.4 3.0 2.0 2.9 Taxes Net earnings 4.5 6.5 Balance Sheet Accounts 2009 2008 Assets Cash 3.2 3.4 Receivables 3.0 4.0 Inventory 4.9 8.7 Prepaid expenses 4.8 6.1 Current assets 15.9 22.2 Plant property and equipment 28.5 32.9 Other long term assets 2.7 4.3 Total long term assets 31.2 37.2 Total assets Liabilities & Equity Short term debt 2.7 3.2 Accounts payable 2.3 3.0 Accrued liabilities 0.4 0.5 Current liabilities 5.4 6.7 Long term debt 17.2 21.7 Owners equity 24.5 31.0 Total capitalization 41.7 52.7 Total liabilities & equity 47.1 59.4 Months of inventory 2.690 2.028 Cost of goods sold sales 0.446 0.451 Long term debt total capital 0.412 0.412 Exhibit 1 Select Income Statement and Balance Sheet Values (SMM) 2009 Income Statement Accounts 2008 Net sales 65.0 86.3 Expenses Cost of goods sold 29.0 38.9 Sales, general and administrative 10.1 14.0 Research and development 13.5 17.0 Depreciation 2.9 3.1 other expenses 0.6 1.0 74.0 Operating expenses 56.1 Interest expense 2.4 3.0 2.0 2.9 Taxes Net earnings 4.5 6.5 Balance Sheet Accounts 2009 2008 Assets Cash 3.2 3.4 Receivables 3.0 4.0 Inventory 4.9 8.7 Prepaid expenses 4.8 6.1 Current assets 15.9 22.2 Plant property and equipment 28.5 32.9 Other long term assets 2.7 4.3 Total long term assets 31.2 37.2 Total assets Liabilities & Equity Short term debt 2.7 3.2 Accounts payable 2.3 3.0 Accrued liabilities 0.4 0.5 Current liabilities 5.4 6.7 Long term debt 17.2 21.7 Owners equity 24.5 31.0 Total capitalization 41.7 52.7 Total liabilities & equity 47.1 59.4 Months of inventory 2.690 2.028 Cost of goods sold sales 0.446 0.451 Long term debt total capital 0.412 0.412
Step by Step Solution
There are 3 Steps involved in it

Get step-by-step solutions from verified subject matter experts