

Question: This case study provides practice in using cost-volume-profit analysis to make an insourcing decision. This case is not a group project. Instead, you are required
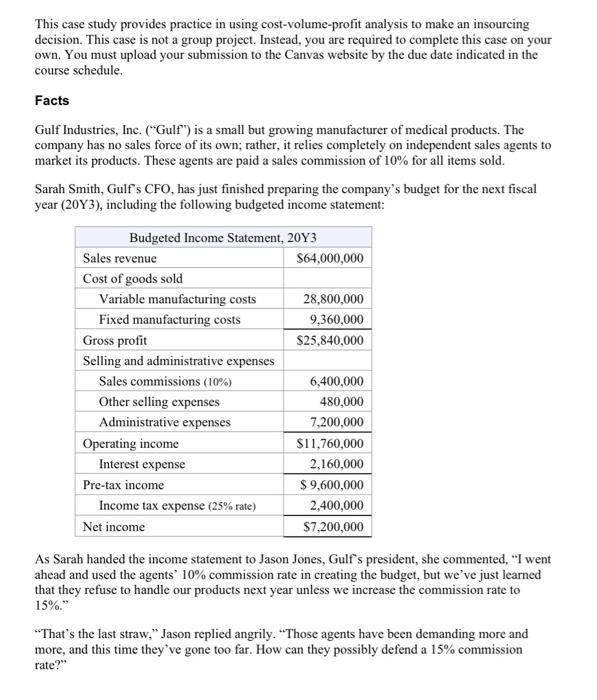
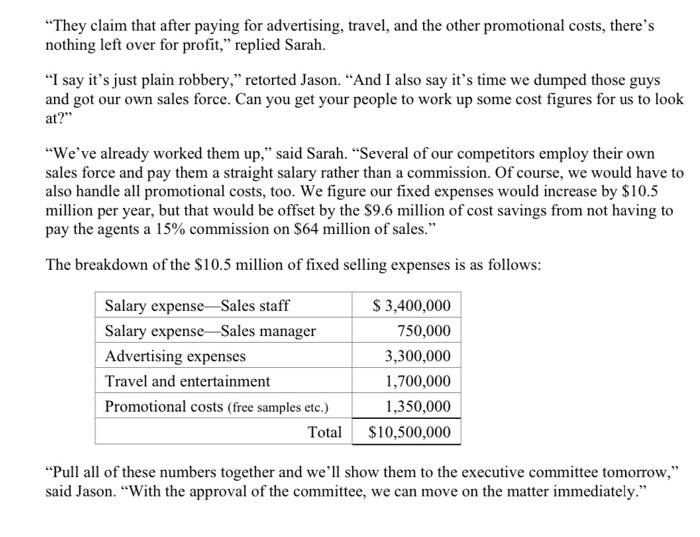
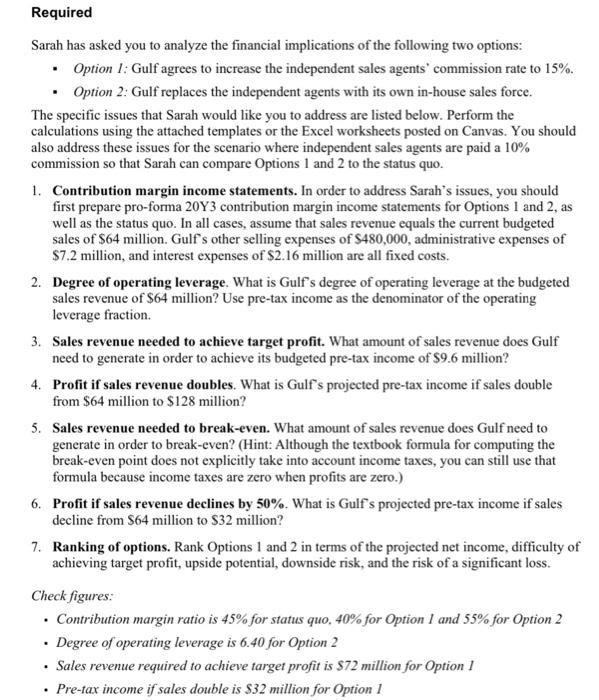
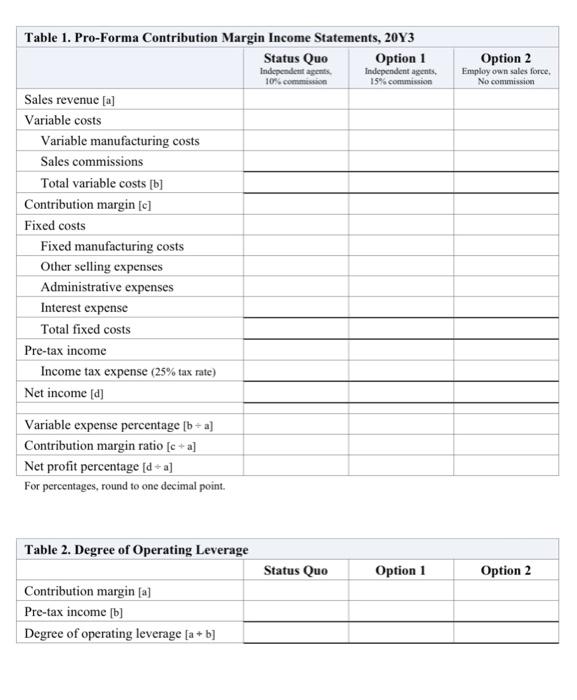
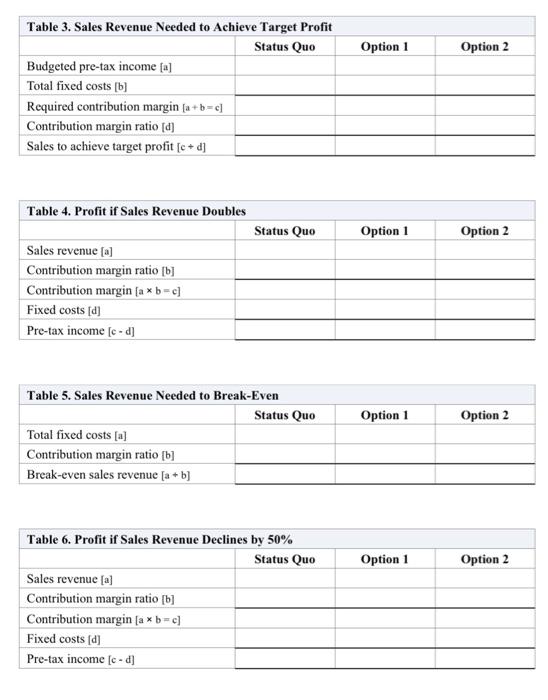
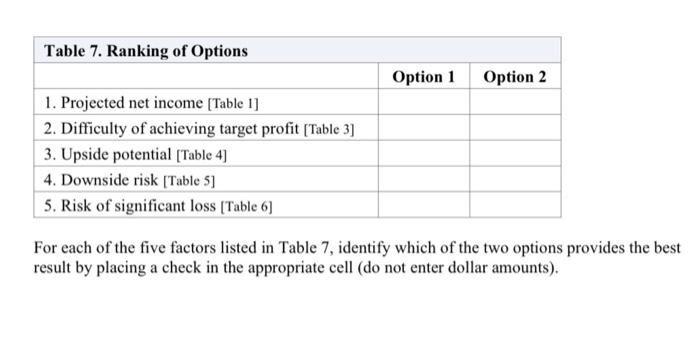
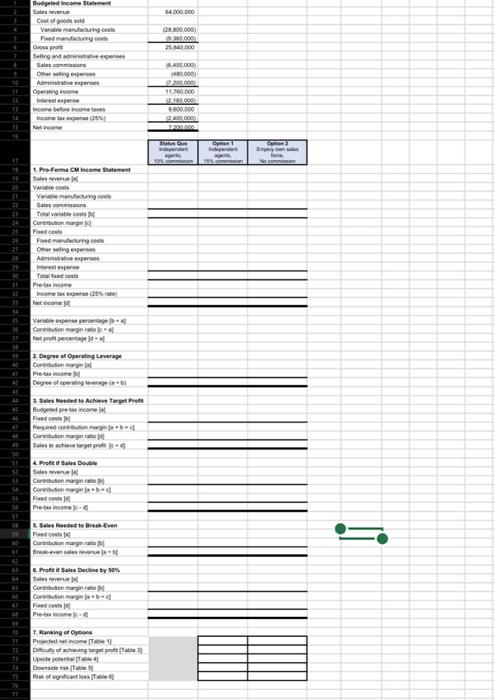
This case study provides practice in using cost-volume-profit analysis to make an insourcing decision. This case is not a group project. Instead, you are required to complete this case on your own. You must upload your submission to the Canvas website by the due date indicated in the course schedule. Facts Gulf Industries, Inc. ("Gulf") is a small but growing manufacturer of medical products. The company has no sales force of its own; rather, it relies completely on independent sales agents to market its products. These agents are paid a sales commission of 10% for all items sold. Sarah Smith, Gulf's CFO, has just finished preparing the company's budget for the next fiscal year (20Y3), including the following budgeted income statement: Budgeted Income Statement, 20Y3 Sales revenue $64,000,000 Cost of goods sold Variable manufacturing costs 28,800,000 Fixed manufacturing costs 9,360,000 Gross profit $25,840,000 Selling and administrative expenses Sales commissions (10%) 6,400,000 Other selling expenses 480,000 Administrative expenses 7,200,000 Operating income $11,760,000 Interest expense 2,160,000 Pre-tax income $ 9,600,000 Income tax expense (25% rate) 2,400,000 Net income $7,200,000 As Sarah handed the income statement to Jason Jones, Gulf's president, she commented, "I went ahead and used the agents' 10% commission rate in creating the budget, but we've just learned that they refuse to handle our products next year unless we increase the commission rate to 15%." "That's the last straw," Jason replied angrily. "Those agents have been demanding more and more, and this time they've gone too far. How can they possibly defend a 15% commission rate?" "They claim that after paying for advertising, travel, and the other promotional costs, there's nothing left over for profit," replied Sarah. "I say it's just plain robbery," retorted Jason. And I also say it's time we dumped those guys and got our own sales force. Can you get your people to work up some cost figures for us to look at?" "We've already worked them up," said Sarah. Several of our competitors employ their own sales force and pay them a straight salary rather than a commission. Of course, we would have to also handle all promotional costs, too. We figure our fixed expenses would increase by $10.5 million per year, but that would be offset by the $9.6 million of cost savings from not having to pay the agents a 15% commission on $64 million of sales." The breakdown of the $10.5 million of fixed selling expenses is as follows: Salary expense-Sales staff Salary expenseSales manager Advertising expenses Travel and entertainment Promotional costs (free samples etc.) Total $ 3,400,000 750,000 3,300,000 1,700,000 1,350,000 $10,500,000 "Pull all of these numbers together and we'll show them to the executive committee tomorrow," said Jason. "With the approval of the committee, we can move on the matter immediately." Required Sarah has asked you to analyze the financial implications of the following two options: Option 1: Gulf agrees to increase the independent sales agents' commission rate to 15%. Option 2: Gulf replaces the independent agents with its own in-house sales force. The specific issues that Sarah would like you to address are listed below. Perform the calculations using the attached templates or the Excel worksheets posted on Canvas. You should also address these issues for the scenario where independent sales agents are paid a 10% commission so that Sarah can compare Options 1 and 2 to the status quo. 1. Contribution margin income statements. In order to address Sarah's issues, you should first prepare pro-forma 2093 contribution margin income statements for Options 1 and 2, as well as the status quo. In all cases, assume that sales revenue equals the current budgeted sales of $64 million. Gulf's other selling expenses of $480,000, administrative expenses of $7.2 million, and interest expenses of $2.16 million are all fixed costs. 2. Degree of operating leverage. What is Gulf's degree of operating leverage at the budgeted sales revenue of $64 million? Use pre-tax income as the denominator of the operating leverage fraction. 3. Sales revenue needed to achieve target profit. What amount of sales revenue does Gulf need to generate in order to achieve its budgeted pre-tax income of $9.6 million? 4. Profit if sales revenue doubles. What is Gulf's projected pre-tax income if sales double from $64 million to $128 million? 5. Sales revenue needed to break-even. What amount of sales revenue does Gulf need to generate in order to break-even? (Hint: Although the textbook formula for computing the break-even point does not explicitly take into account income taxes, you can still use that formula because income taxes are zero when profits are zero.) 6. Profit if sales revenue declines by 50%. What is Gulf s projected pre-tax income if sales decline from $64 million to $32 million? 7. Ranking of options. Rank Options 1 and 2 in terms of the projected net income, difficulty of achieving target profit, upside potential, downside risk, and the risk of a significant loss. Check figures: Contribution margin ratio is 45% for status quo, 40% for Option 1 and 55% for Option 2 Degree of operating leverage is 6.40 for Option 2 Sales revenue required to achieve target profit is $72 million for Option ! Pre-tax income if sales double is $32 million for Option 1 . . . Option 2 Employ own sales force No commission Table 1. Pro-Forma Contribution Margin Income Statements, 20Y3 Status Quo Option 1 Independent agents Independent agents 10% commission 15% commission Sales revenue (a) Variable costs Variable manufacturing costs Sales commissions Total variable costs [b] Contribution margin (c) Fixed costs Fixed manufacturing costs Other selling expenses Administrative expenses Interest expense Total fixed costs Pre-tax income Income tax expense (25% tax rate) Net income (a) Variable expense percentage (b + a) Contribution margin ratio [c+a] Net profit percentage [da] For percentages, round to one decimal point. Table 2. Degree of Operating Leverage Status Quo Option 1 Option 2 Contribution marginal Pre-tax income [b] Degree of operating leverage (a + b] Option 1 Option 2 Table 3. Sales Revenue Needed to Achieve Target Profit Status Quo Budgeted pre-tax income (a] Total fixed costs [6] Required contribution margin (a + bc) Contribution margin ratio [a] Sales to achieve target profit [c+d] Table 4. Profit if Sales Revenue Doubles Status Quo Option 1 Option 2 Sales revenue [a] Contribution margin ratio [b] Contribution margin [a b c] Fixed costs [d] Pre-tax income [e-d] Option 1 Option 2 Table 5. Sales Revenue Needed to Break-Even Status Quo Total fixed costs [a] Contribution margin ratio [b] Break-even sales revenue [a+b] Option 1 Option 2 Table 6. Profit if Sales Revenue Declines by 50% Status Quo Sales revenue (a) Contribution margin ratio [b] Contribution margin (a*b+c] Fixed costs [d] Pre-tax income (c-d] Table 7. Ranking of Options Option 1 Option 2 1. Projected net income (Table 1] 2. Difficulty of achieving target profit (Table 3] 3. Upside potential (Table 4] 4. Downside risk (Table 51 5. Risk of significant loss [Table 6] For each of the five factors listed in Table 7, identify which of the two options provides the best result by placing a check in the appropriate cell (do not enter dollar amounts). 64.000.000 2.800.000 25 M DOO Budgeted Income Sales reven Costo de Variable mango Fungo Grosso Seling and Som Ofering perse Avespero Opening Interessere Income before Income 2 Nel 6.600.000 40000 37299.00 19 180.000 2.600.000 20 den . Pro-Ferma CM Income Statement SIN Variable cos Viroblemele Seis com Total Cabution Pedag Owing Alive Todos Petani Income Net Income V peper Cover Netpro 2 Degree of Operating Leverage Con Preta come Degree of pestige 2. Sales Needed to achieve Target Profit Puteti come Cotong Sales love Profitif Sales Double Sales Cerita Coro Pwed Sales Needed to Break Ivan Contribution Breakers c. Pot Sale Decline by Sales Corbert Corbud Pre-income Ranking of Options Procedencome Diety of schuing target proto Downside of giant Table
Step by Step Solution
There are 3 Steps involved in it

Get step-by-step solutions from verified subject matter experts