

Question: This c-chart shows a process that goes out of control. At about the 12th or 13th sample, the average number of machine failures more than
This c-chart shows a process that goes out of control. At about the 12th or 13th sample, the average number of machine failures more than doubles. Click on the graph to generate a new set of 25 samples. Can you see the signs that the process is out of control in the second half of the samples? Sometimes it is difficult.
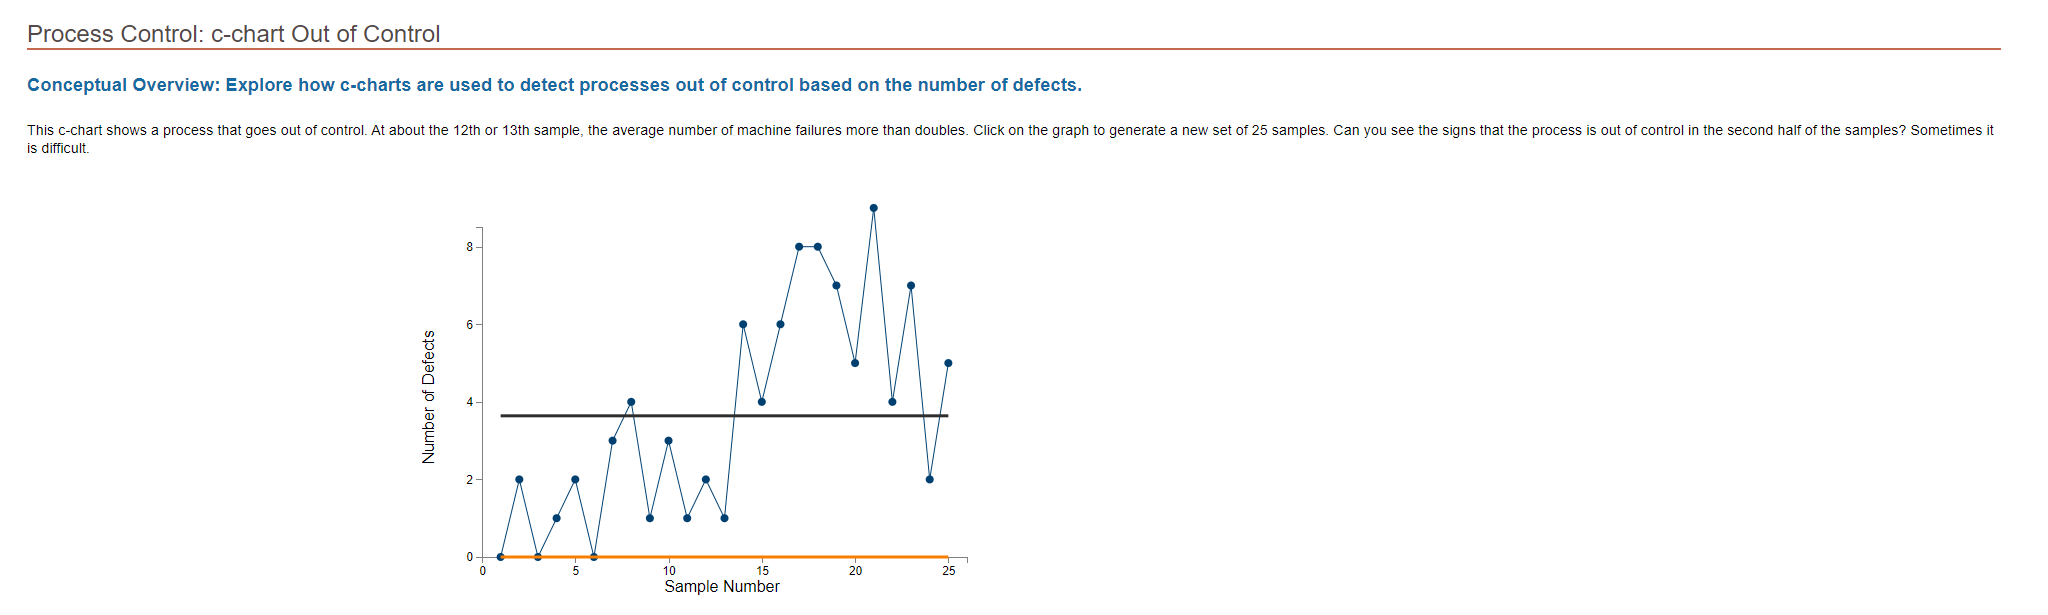
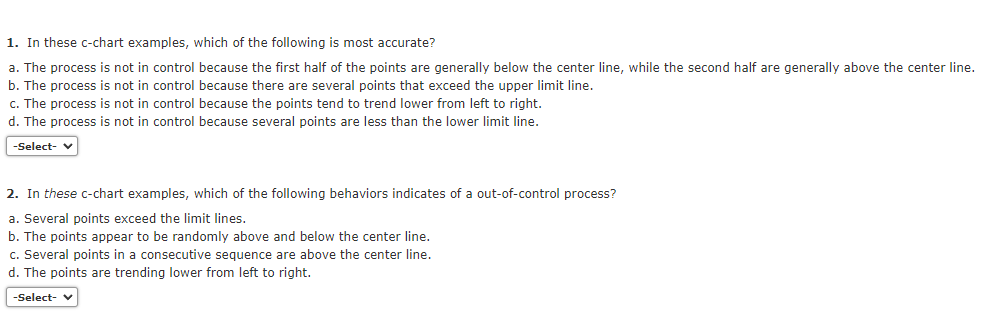
Conceptual Overview: Explore how c-charts are used to detect processes out of control based on the number of defects. is difficult. 1. In these c-chart examples, which of the following is most accurate? a. The process is not in control because the first half of the points are generally below the center line, while the second half are generally above the center line. b. The process is not in control because there are several points that exceed the upper limit line. c. The process is not in control because the points tend to trend lower from left to right. d. The process is not in control because several points are less than the lower limit line. 2. In these c-chart examples, which of the following behaviors indicates of a out-of-control process? a. Several points exceed the limit lines. b. The points appear to be randomly above and below the center line. c. Several points in a consecutive sequence are above the center line. d. The points are trending lower from left to right
Step by Step Solution
There are 3 Steps involved in it

Get step-by-step solutions from verified subject matter experts