

Question: This chart most likely shows what? Fixed Cost ( F ) Fixed Cost ( F ) + Total Variable Cost ( V * * Q
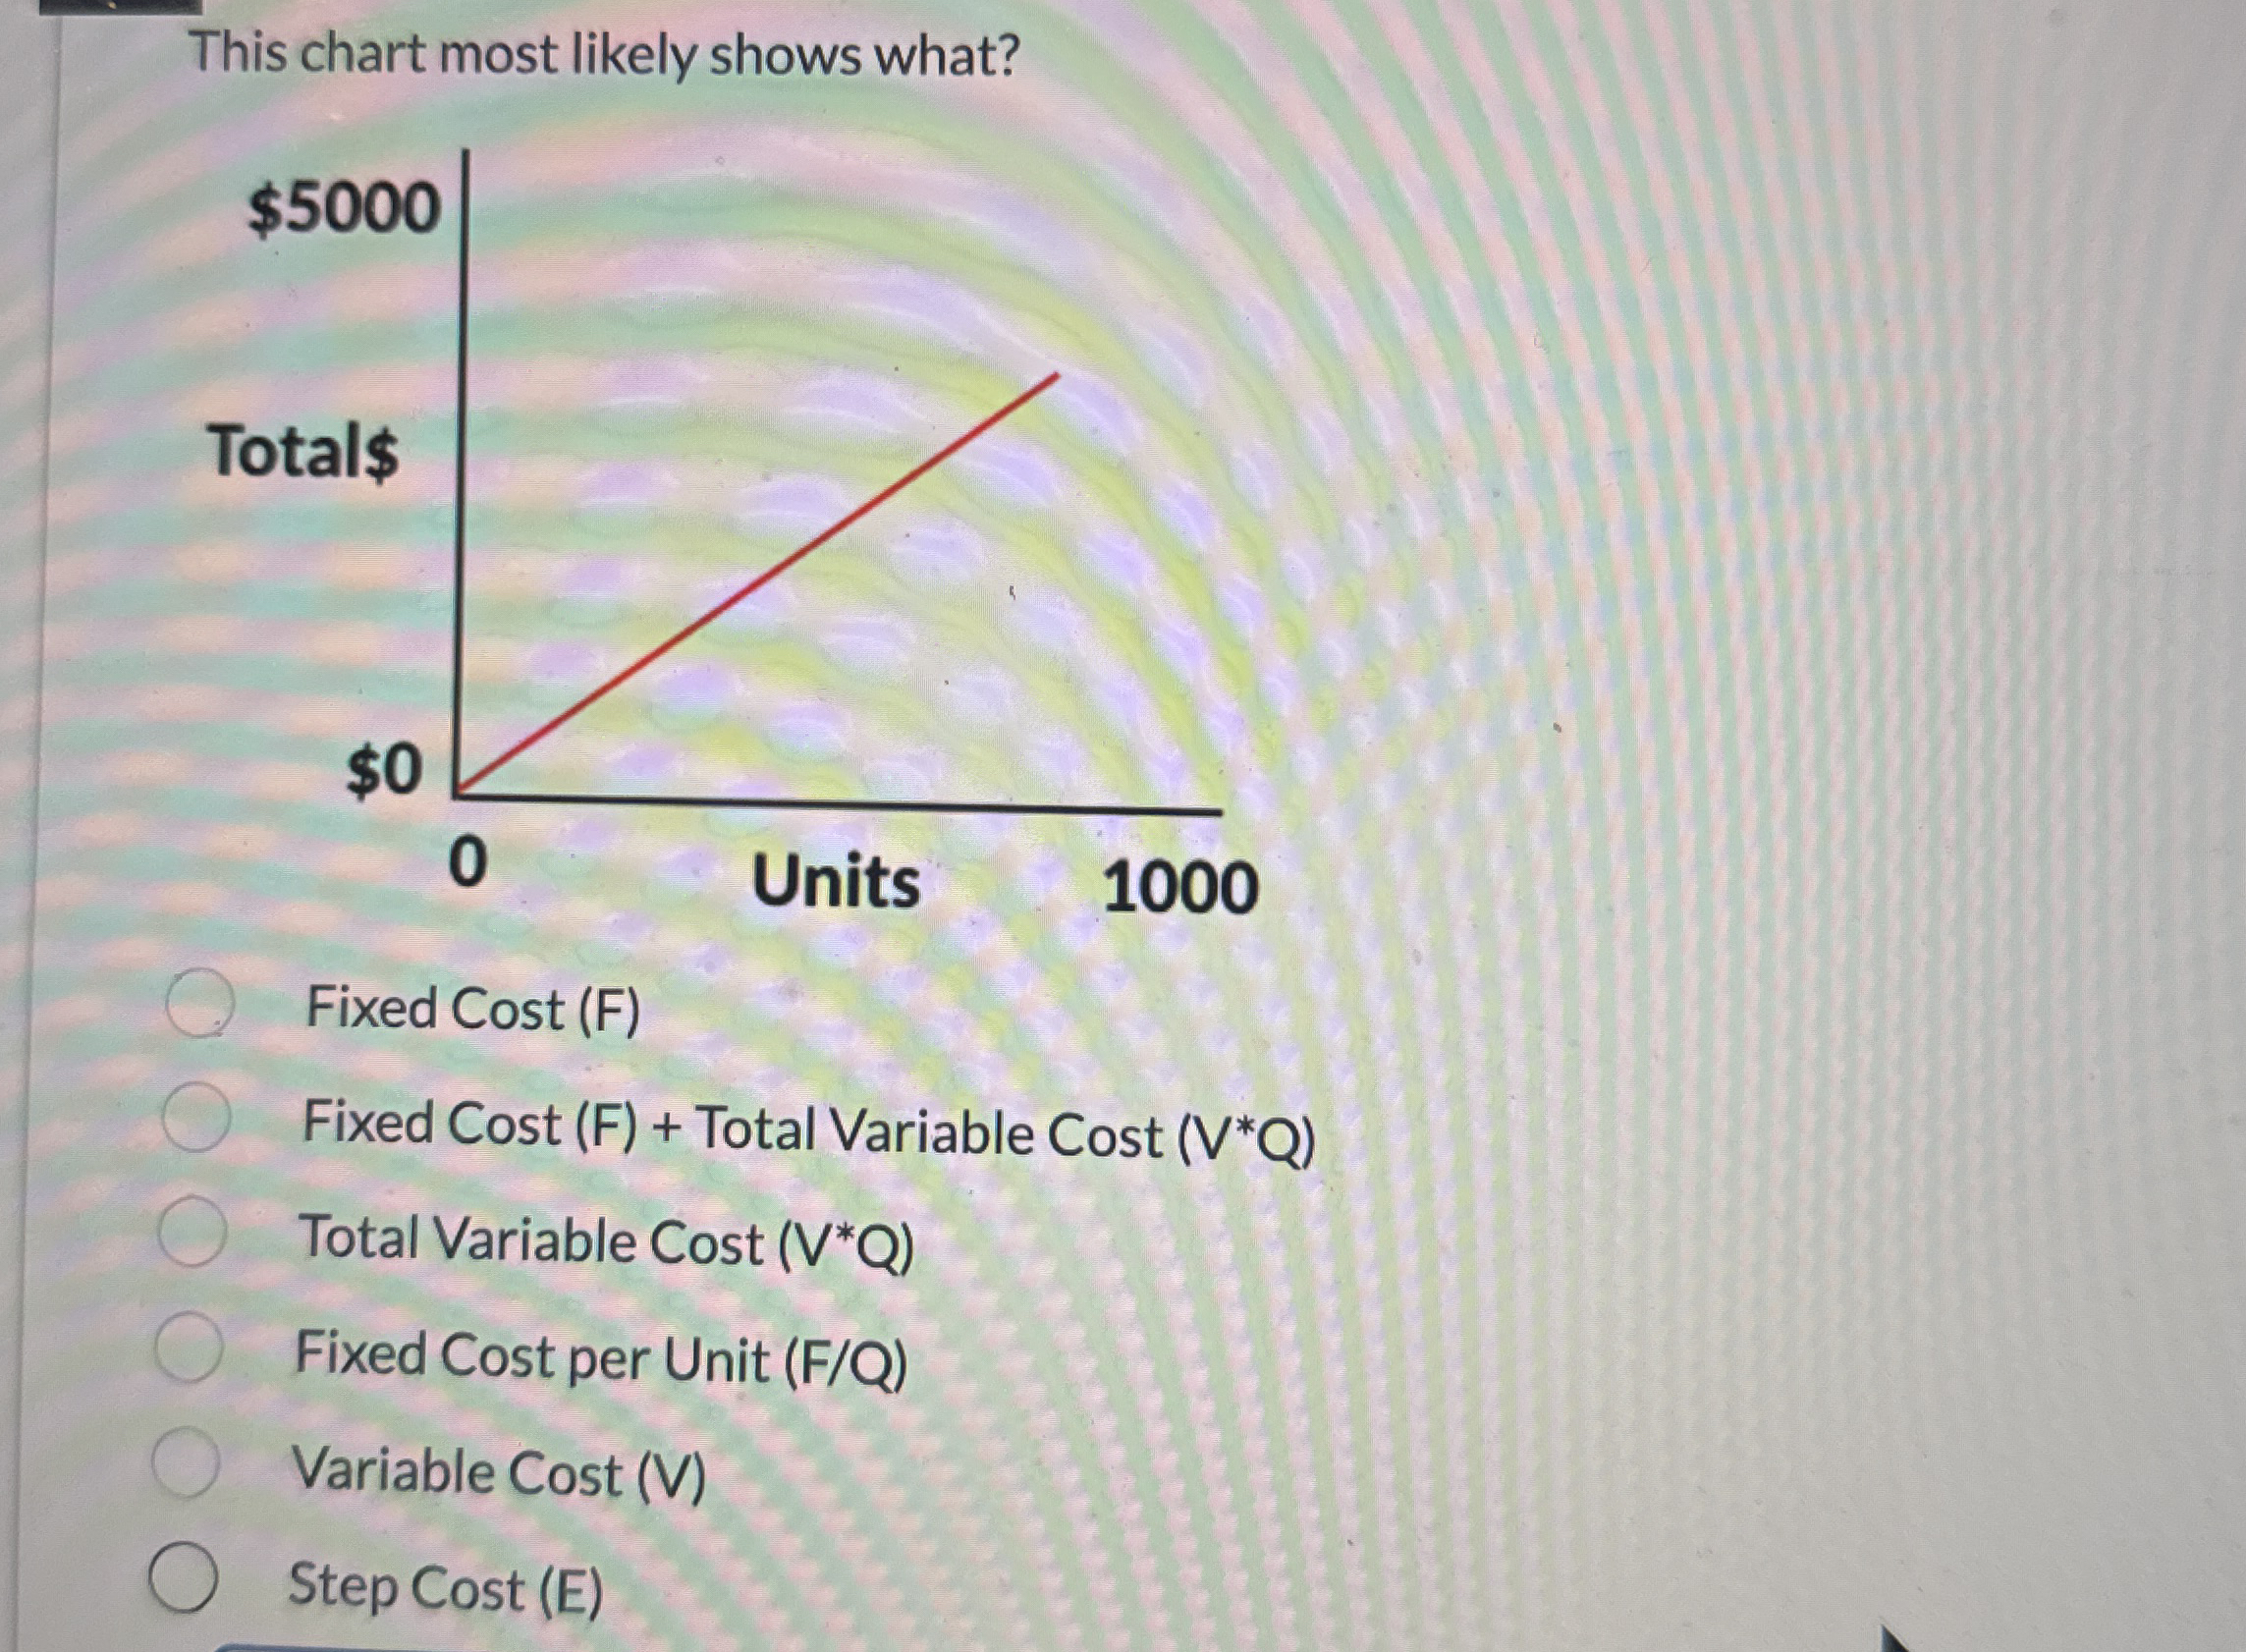
This chart most likely shows what?
Fixed Cost F
Fixed Cost F Total Variable Cost
Total Variable Cost
Fixed Cost per Unit FQ
Variable Cost V
Step Cost E
Step by Step Solution
There are 3 Steps involved in it
1 Expert Approved Answer
Step: 1 Unlock

Question Has Been Solved by an Expert!
Get step-by-step solutions from verified subject matter experts
Step: 2 Unlock
Step: 3 Unlock