

Question: This circuit is hard to analyse mathematically. However, MultisimLive allows us to see its frequency response. i . Provide an image from MultisimLive showing your
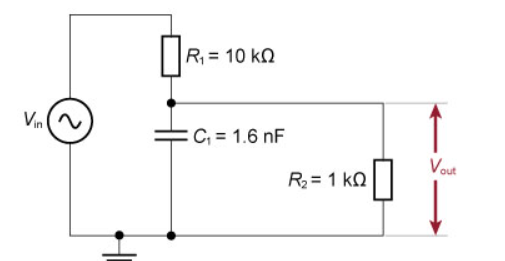
This circuit is hard to analyse mathematically. However, MultisimLive allows us to see its frequency response.
iProvide an image from MultisimLive showing your version of Figure In MultisimLive, perform an AC Sweep and include an image of the grapher output showing input amplitude variation and output amplitude variation with frequency over the default frequency range. Do not include phase. Include coordinates showing gain at kHz
iiDiscuss your graphs in ci above. In particular, explain the lowfrequency gain and the location of the cutoff point in the new arrangement. Include diagrams or graphs if they help.
dModify your MultisimLive circuit to include an opamp acting as a unitygain buffer between the filter and the load R Block pp and shows examples of buffer amplifiers used in this way. In your MultisimLive circuit use the terminal opamp as it does not require you to provide a power supply or additional components. Provide images from MultisimLive showing your circuit and the graph from an AC Sweep. For the AC Sweep, use the default frequency range and, in the graph, show magnitudes only; do not include phases. Show that the inclusion of the buffer has restored the behaviour to that expected of the unloaded filter. You should notice, however, that the opamp introduces an additional rolloff.
Step by Step Solution
There are 3 Steps involved in it
1 Expert Approved Answer
Step: 1 Unlock

Question Has Been Solved by an Expert!
Get step-by-step solutions from verified subject matter experts
Step: 2 Unlock
Step: 3 Unlock