

Question: This code needs to be written in R Program, preferably in RS Studio Introduction A research team investigates selection performance with two types of menus:
This code needs to be written in R Program, preferably in RS Studio
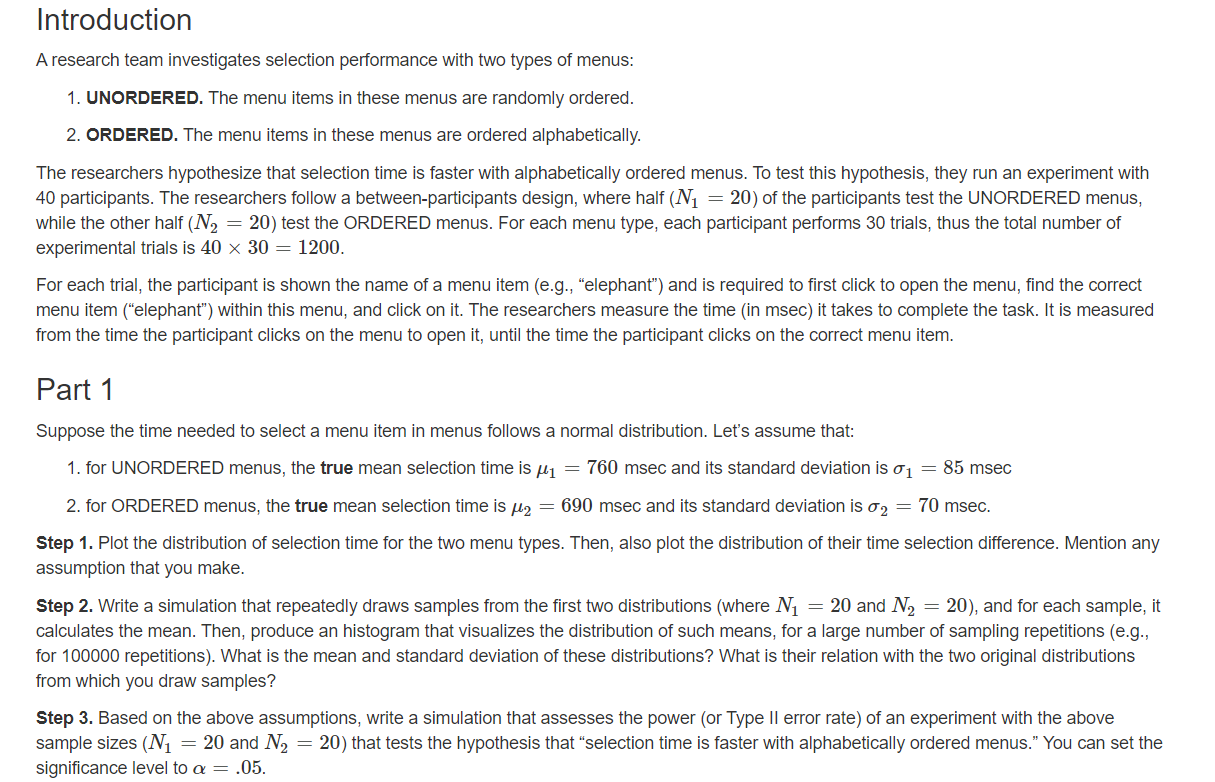
Introduction A research team investigates selection performance with two types of menus: 1. UNORDERED. The menu items in these menus are randomly ordered. 2. ORDERED. The menu items in these menus are ordered alphabetically. The researchers hypothesize that selection time is faster with alphabetically ordered menus. To test this hypothesis, they run an experiment with 40 participants. The researchers follow a between-participants design, where half (N1 = 20) of the participants test the UNORDERED menus, while the other half (N2 = 20) test the ORDERED menus. For each menu type, each participant performs 30 trials, thus the total number of experimental trials is 40 x 30 = 1200. For each trial, the participant is shown the name of a menu item (e.g., "elephant") and is required to first click to open the menu, find the correct menu item ("elephant") within this menu, and click on it. The researchers measure the time in msec) it takes to complete the task. It is measured from the time the participant clicks on the menu to open it, until the time the participant clicks on the correct menu item. Part 1 Suppose the time needed to select a menu item in menus follows a normal distribution. Let's assume that: 1. for UNORDERED menus, the true mean selection time is pl1 = 760 msec and its standard deviation is 01 = 85 msec 2. for ORDERED menus, the true mean selection time is 2 = 690 msec and its standard deviation is 0 2 = 70 msec. Step 1. Plot the distribution of selection time for the two menu types. Then, also plot the distribution of their time selection difference. Mention any assumption that you make. Step 2. Write a simulation that repeatedly draws samples from the first two distributions (where Ni = 20 and N2 = 20), and for each sample, it calculates the mean. Then, produce an histogram that visualizes the distribution of such means, for a large number of sampling repetitions (e.g., for 100000 repetitions). What is the mean and standard deviation of these distributions? What is their relation with the two original distributions from which you draw samples? Step 3. Based on the above assumptions, write a simulation that assesses the power (or Type Il error rate) of an experiment with the above sample sizes (N1 = 20 and N2 = 20) that tests the hypothesis that selection time is faster with alphabetically ordered menus." You can set the significance level to a = .05. Introduction A research team investigates selection performance with two types of menus: 1. UNORDERED. The menu items in these menus are randomly ordered. 2. ORDERED. The menu items in these menus are ordered alphabetically. The researchers hypothesize that selection time is faster with alphabetically ordered menus. To test this hypothesis, they run an experiment with 40 participants. The researchers follow a between-participants design, where half (N1 = 20) of the participants test the UNORDERED menus, while the other half (N2 = 20) test the ORDERED menus. For each menu type, each participant performs 30 trials, thus the total number of experimental trials is 40 x 30 = 1200. For each trial, the participant is shown the name of a menu item (e.g., "elephant") and is required to first click to open the menu, find the correct menu item ("elephant") within this menu, and click on it. The researchers measure the time in msec) it takes to complete the task. It is measured from the time the participant clicks on the menu to open it, until the time the participant clicks on the correct menu item. Part 1 Suppose the time needed to select a menu item in menus follows a normal distribution. Let's assume that: 1. for UNORDERED menus, the true mean selection time is pl1 = 760 msec and its standard deviation is 01 = 85 msec 2. for ORDERED menus, the true mean selection time is 2 = 690 msec and its standard deviation is 0 2 = 70 msec. Step 1. Plot the distribution of selection time for the two menu types. Then, also plot the distribution of their time selection difference. Mention any assumption that you make. Step 2. Write a simulation that repeatedly draws samples from the first two distributions (where Ni = 20 and N2 = 20), and for each sample, it calculates the mean. Then, produce an histogram that visualizes the distribution of such means, for a large number of sampling repetitions (e.g., for 100000 repetitions). What is the mean and standard deviation of these distributions? What is their relation with the two original distributions from which you draw samples? Step 3. Based on the above assumptions, write a simulation that assesses the power (or Type Il error rate) of an experiment with the above sample sizes (N1 = 20 and N2 = 20) that tests the hypothesis that selection time is faster with alphabetically ordered menus." You can set the significance level to a = .05
Step by Step Solution
There are 3 Steps involved in it

Get step-by-step solutions from verified subject matter experts