

Question: ?This data is from the Household Survey as reported in the monthlyBLS Employment Situation Report..All variables are measured in thousands of persons. These are levels,not
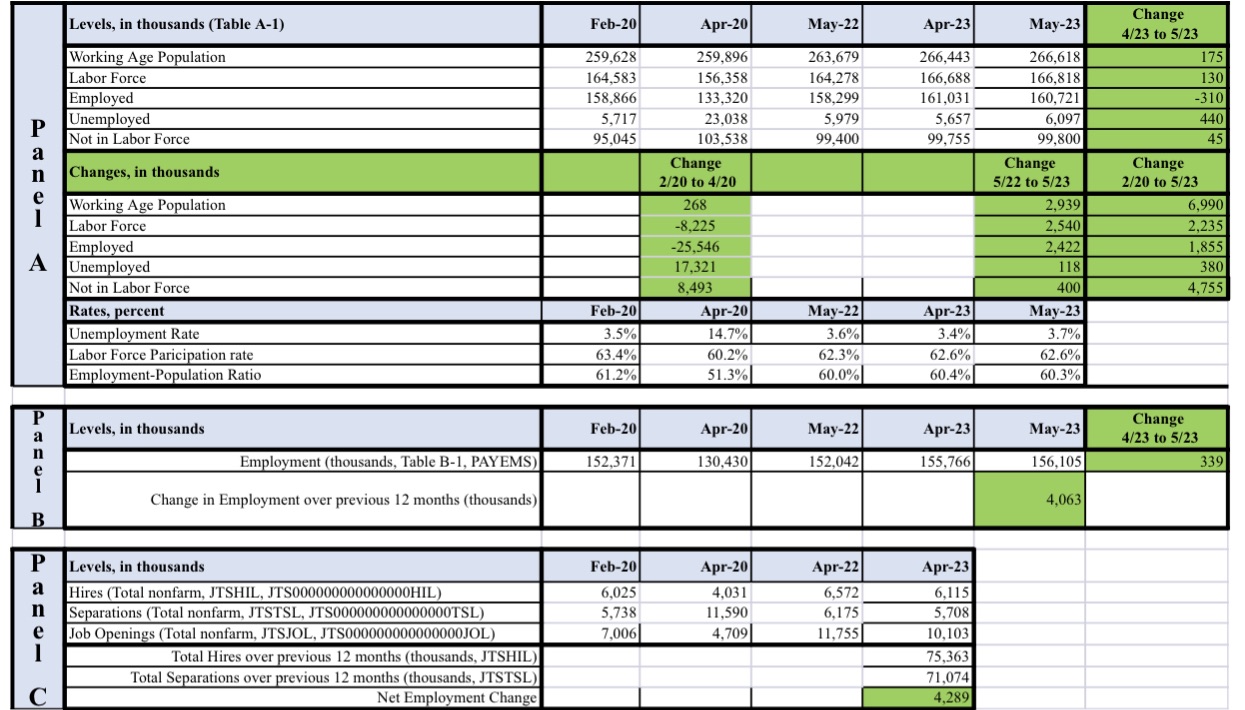
?This data is from the Household Survey as reported in the monthlyBLS Employment Situation Report..All variables are measured in thousands of persons. These are levels,not rates.?When looking at FRED time series charts, the gray bars indicate recessions. The white spaces between the gray bars are expansions.The date of the peak corresponds with the left edge of the gray bar.The date of the trough corresponds with the right edge of the gray bar.?Put your cursor on the graph to see the data values for each date. o Examine the general trends in the Labor Force, Employment, and Unemployment levels over the entire period since 1950. Write down three (3) observations.?Click in the date box above the chart and change the start date to 1/1/2000 and the end date to 2/1/2020.o Examine the changes in the Labor Force, Employment, and Unemployment before, during, and after the Great Recession (12/2007-6/2009). Note how long it takes for each to return to their pre-recession levels. Write down three (3) observations.?Click in the date box above the chart and change the end date to 5/1/23and the start date to 1/1/2019.o Examine the changes in the Labor Force, Employment, and Unemployment before, during, and after the Pandemic Recession (2/2020-4/2020). Note how long it takes for each to return to their pre-recession levels. Write down three (3) observations.
Step by Step Solution
There are 3 Steps involved in it

Get step-by-step solutions from verified subject matter experts