

Question: This data needs to be solved by using neural network software and SVM software. r The bankruptcy-prediction problem can be viewed as a problem of
This data needs to be solved by using neural network software and SVM software.
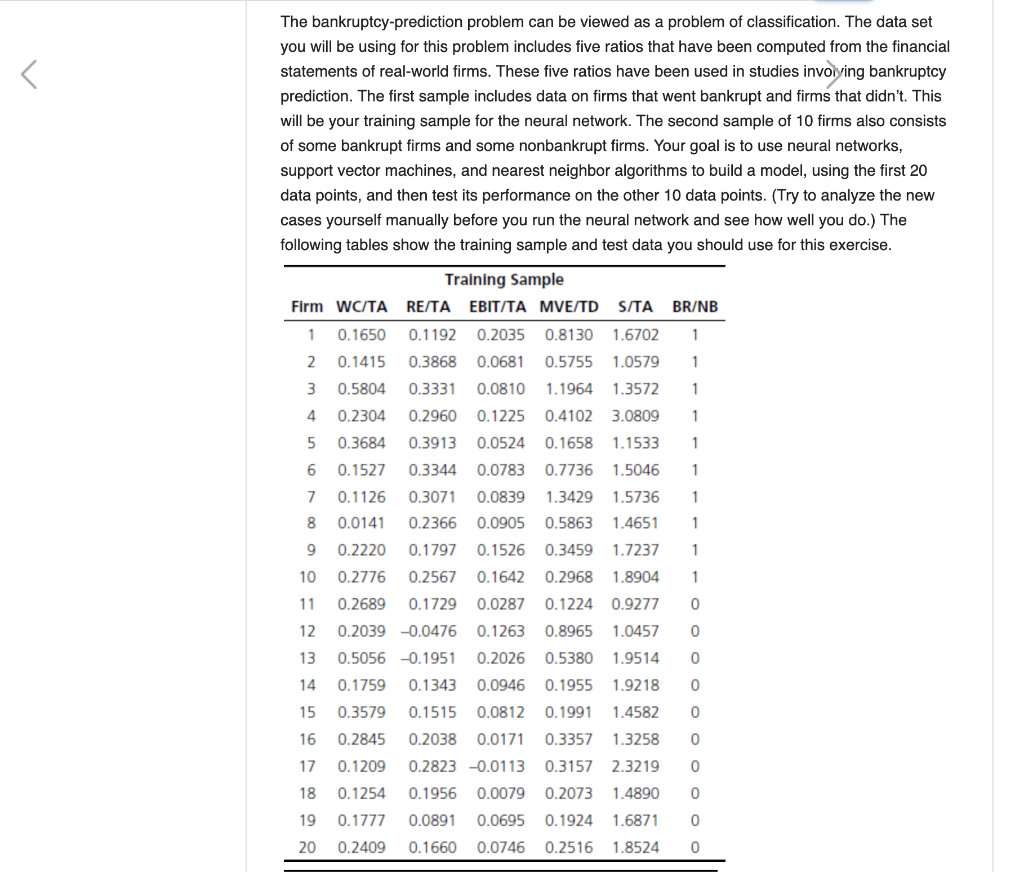
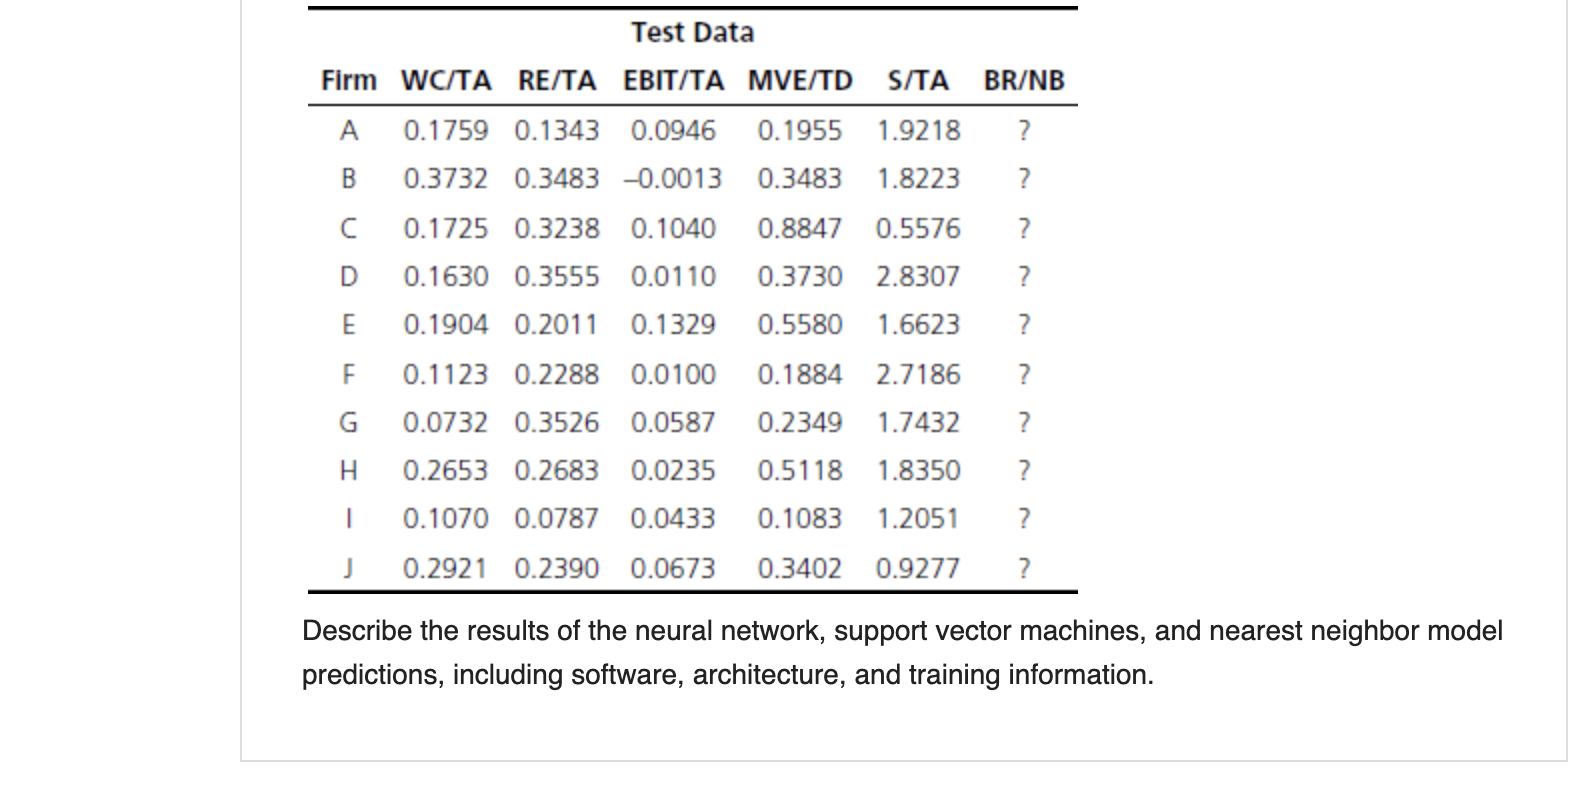
r The bankruptcy-prediction problem can be viewed as a problem of classification. The data set you will be using for this problem includes five ratios that have been computed from the financial statements of real-world firms. These five ratios have been used in studies involving bankruptcy prediction. The first sample includes data on firms that went bankrupt and firms that didn't. This will be your training sample for the neural network. The second sample of 10 firms also consists of some bankrupt firms and some nonbankrupt firms. Your goal is to use neural networks, support vector machines, and nearest neighbor algorithms to build a model, using the first 20 data points, and then test its performance on the other 10 data points. (Try to analyze the new cases yourself manually before you run the neural network and see how well you do.) The following tables show the training sample and test data you should use for this exercise. BR/NB 1 1 1 1 1 1 1 1 1 Training Sample Firm WC/TA RE/TA EBIT/TA MVE/TD S/TA 1 0.1650 0.1192 0.2035 0.8130 1.6702 2 0.1415 0.3868 0.0681 0.5755 1.0579 3 0.5804 0.3331 0.0810 1.1964 1.3572 4 0.2304 0.2960 0.1225 0.4102 3.0809 5 0.3684 0.3913 0.0524 0.1658 1.1533 6 0.1527 0.3344 0.0783 0.7736 1.5046 7 0.1126 0.3071 0.0839 1.3429 1.5736 8 0.0141 0.2366 0.0905 0.5863 1.4651 9 0.2220 0.1797 0.1526 0.3459 1.7237 10 0.2776 0.2567 0.1642 0.2968 1.8904 11 0.2689 0.1729 0.0287 0.1224 0.9277 12 0.2039 -0.0476 0.1263 0.8965 1.0457 13 0.5056 -0.1951 0.2026 0.5380 1.9514 14 0.1759 0.1343 0.0946 0.1955 1.9218 15 0.3579 0.1515 0.0812 0.1991 1.4582 16 0.2845 0.2038 0.0171 0.3357 1.3258 17 0.1209 0.2823 -0.0113 0.3157 2.3219 18 0.1254 0.1956 0.0079 0.2073 1.4890 19 0.1777 0.0891 0.0695 0.1924 1.6871 20 0.2409 0.1660 0.0746 0.2516 1.8524 1 0 0 0 0 0 0 0 0 0 0 BR/NB ? ? ? Test Data Firm WC/TA RE/TA EBIT/TA MVE/TD S/TA A 0.1759 0.1343 0.0946 0.1955 1.9218 B 0.3732 0.3483 -0.0013 0.3483 1.8223 0.1725 0.3238 0.1040 0.8847 0.5576 D 0.1630 0.3555 0.0110 0.3730 2.8307 E 0.1904 0.2011 0.1329 0.5580 1.6623 F 0.1123 0.2288 0.0100 0.1884 2.7186 G 0.0732 0.3526 0.0587 0.2349 1.7432 H 0.2653 0.2683 0.0235 0.5118 1.8350 1 0.1070 0.0787 0.0433 0.1083 1.2051 ? ? ? ? ? ? j 0.2921 0.2390 0.0673 0.3402 0.9277 ? Describe the results of the neural network, support vector machines, and nearest neighbor model predictions, including software, architecture, and training information. r The bankruptcy-prediction problem can be viewed as a problem of classification. The data set you will be using for this problem includes five ratios that have been computed from the financial statements of real-world firms. These five ratios have been used in studies involving bankruptcy prediction. The first sample includes data on firms that went bankrupt and firms that didn't. This will be your training sample for the neural network. The second sample of 10 firms also consists of some bankrupt firms and some nonbankrupt firms. Your goal is to use neural networks, support vector machines, and nearest neighbor algorithms to build a model, using the first 20 data points, and then test its performance on the other 10 data points. (Try to analyze the new cases yourself manually before you run the neural network and see how well you do.) The following tables show the training sample and test data you should use for this exercise. BR/NB 1 1 1 1 1 1 1 1 1 Training Sample Firm WC/TA RE/TA EBIT/TA MVE/TD S/TA 1 0.1650 0.1192 0.2035 0.8130 1.6702 2 0.1415 0.3868 0.0681 0.5755 1.0579 3 0.5804 0.3331 0.0810 1.1964 1.3572 4 0.2304 0.2960 0.1225 0.4102 3.0809 5 0.3684 0.3913 0.0524 0.1658 1.1533 6 0.1527 0.3344 0.0783 0.7736 1.5046 7 0.1126 0.3071 0.0839 1.3429 1.5736 8 0.0141 0.2366 0.0905 0.5863 1.4651 9 0.2220 0.1797 0.1526 0.3459 1.7237 10 0.2776 0.2567 0.1642 0.2968 1.8904 11 0.2689 0.1729 0.0287 0.1224 0.9277 12 0.2039 -0.0476 0.1263 0.8965 1.0457 13 0.5056 -0.1951 0.2026 0.5380 1.9514 14 0.1759 0.1343 0.0946 0.1955 1.9218 15 0.3579 0.1515 0.0812 0.1991 1.4582 16 0.2845 0.2038 0.0171 0.3357 1.3258 17 0.1209 0.2823 -0.0113 0.3157 2.3219 18 0.1254 0.1956 0.0079 0.2073 1.4890 19 0.1777 0.0891 0.0695 0.1924 1.6871 20 0.2409 0.1660 0.0746 0.2516 1.8524 1 0 0 0 0 0 0 0 0 0 0 BR/NB ? ? ? Test Data Firm WC/TA RE/TA EBIT/TA MVE/TD S/TA A 0.1759 0.1343 0.0946 0.1955 1.9218 B 0.3732 0.3483 -0.0013 0.3483 1.8223 0.1725 0.3238 0.1040 0.8847 0.5576 D 0.1630 0.3555 0.0110 0.3730 2.8307 E 0.1904 0.2011 0.1329 0.5580 1.6623 F 0.1123 0.2288 0.0100 0.1884 2.7186 G 0.0732 0.3526 0.0587 0.2349 1.7432 H 0.2653 0.2683 0.0235 0.5118 1.8350 1 0.1070 0.0787 0.0433 0.1083 1.2051 ? ? ? ? ? ? j 0.2921 0.2390 0.0673 0.3402 0.9277 ? Describe the results of the neural network, support vector machines, and nearest neighbor model predictions, including software, architecture, and training information
Step by Step Solution
There are 3 Steps involved in it

Get step-by-step solutions from verified subject matter experts