

Question: This data represents the chirp Linear Regression Lab frequency with respect to the temperature for crickets. Chirps/Second Temperature ( F) 1. Use the T183 calculator
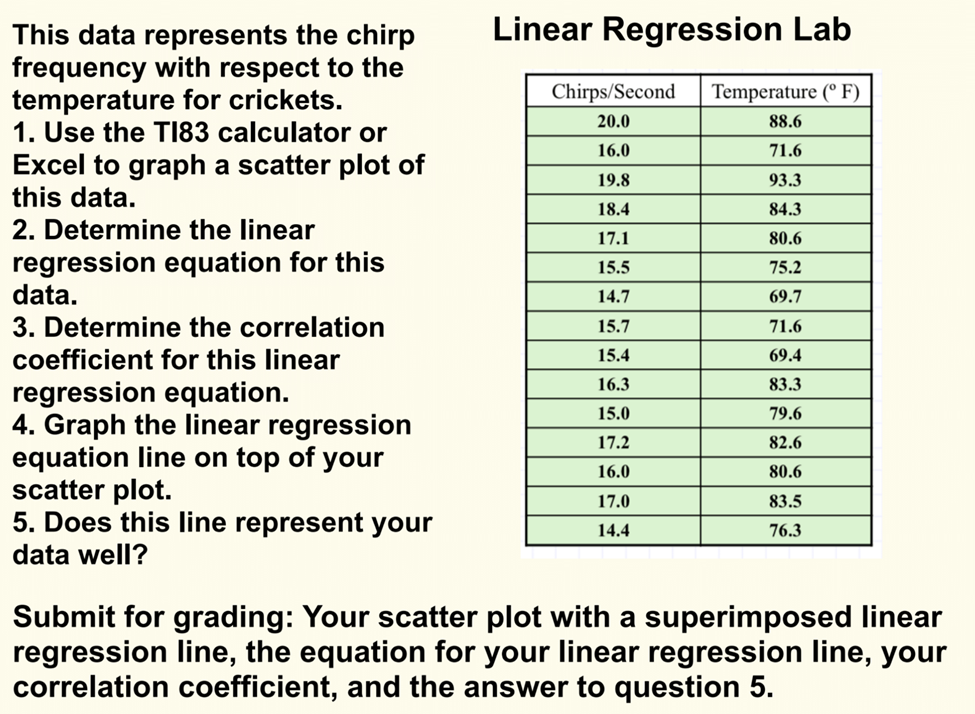

This data represents the chirp Linear Regression Lab frequency with respect to the temperature for crickets. Chirps/Second Temperature ( F) 1. Use the T183 calculator or 20.0 88.6 16.0 71.6 Excel to graph a scatter plot of 19.8 93.3 this data. 18.4 84.3 2. Determine the linear 17.1 80.6 regression equation for this 15.5 75.2 data. 14.7 69.7 3. Determine the correlation 15.7 71.6 coefficient for this linear 15.4 69.4 regression equation. 16.3 83.3 4. Graph the linear regression 15.0 79.6 17.2 82.6 equation line on top of your 16.0 80.6 scatter plot. 17.0 83.5 5. Does this line represent your 14.4 76.3 data well? Submit for grading: Your scatter plot with a superimposed linear regression line, the equation for your linear regression line, your correlation coefficient, and the answer to question 5
Step by Step Solution
There are 3 Steps involved in it

Get step-by-step solutions from verified subject matter experts