

Question: This data set is a sample of Web server statistics for a computer science department. It contains the following 11 sections of data: Total successful
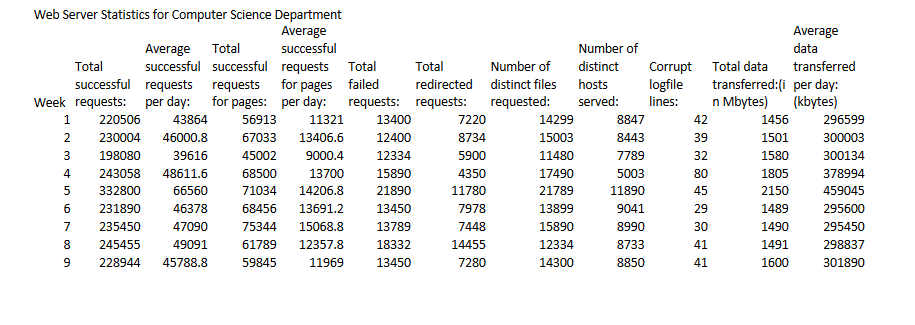
This data set is a sample of Web server statistics for a computer science department. It contains the following 11 sections of data:
- Total successful requests
- Average successful requests per day
- Total successful requests for pages
- Average successful requests for pages per day
- Total failed requests
- Total redirected requests
- Number of distinct files requested
- Number of distinct hosts served
- Corrupt log file lines
- Total data transferred
- Average data transferred per day
essay of 2 page that contains the following:
- A complete overview of the data, identifying anomalies in different weeks, and the weeks that the data are not regular.
- Choose 5 different sections of data, examine these sections, and provide the specific selection process and criteria you used to select this data set.
- Provide the measures of tendency and dispersion for each of the 5 different sections of data you selected.
- Provide 1 chart or graph for each of the 5 processed sections. This may be a pie or bar chart or a histogram.
- Label the chart or graph clearly.
- Explain why the graph you provided gave a good visual representation of the data.
- Based on your explanation above, identify some specific advantages why, in general, charts and graphs are important in conveying information in a visual format.
- Determine the standard deviation and variation for each of the 5 selected sections of data, and explain their importance in statistical analysis of a data set.
- Based on the tasks you performed in this project, research how statistics are used in information technology (IT), and provide references for your research
Your essay should include proper citation in APA , both in-text, . Include a title page and use 12-point ,TNR double - font font throughout the text.
This assignment will also be assessed using additional criteria provided here.
\f
Step by Step Solution
There are 3 Steps involved in it
1 Expert Approved Answer
Step: 1 Unlock

Question Has Been Solved by an Expert!
Get step-by-step solutions from verified subject matter experts
Step: 2 Unlock
Step: 3 Unlock