

Question: This diagram goes the the second picture.. please help d Learn ims.au.af.edu Troy Canvas Drown Summary & A. Factor a polynomial or... (@gcf a^4b^5, a^7b45
This diagram goes the the second picture.. please help
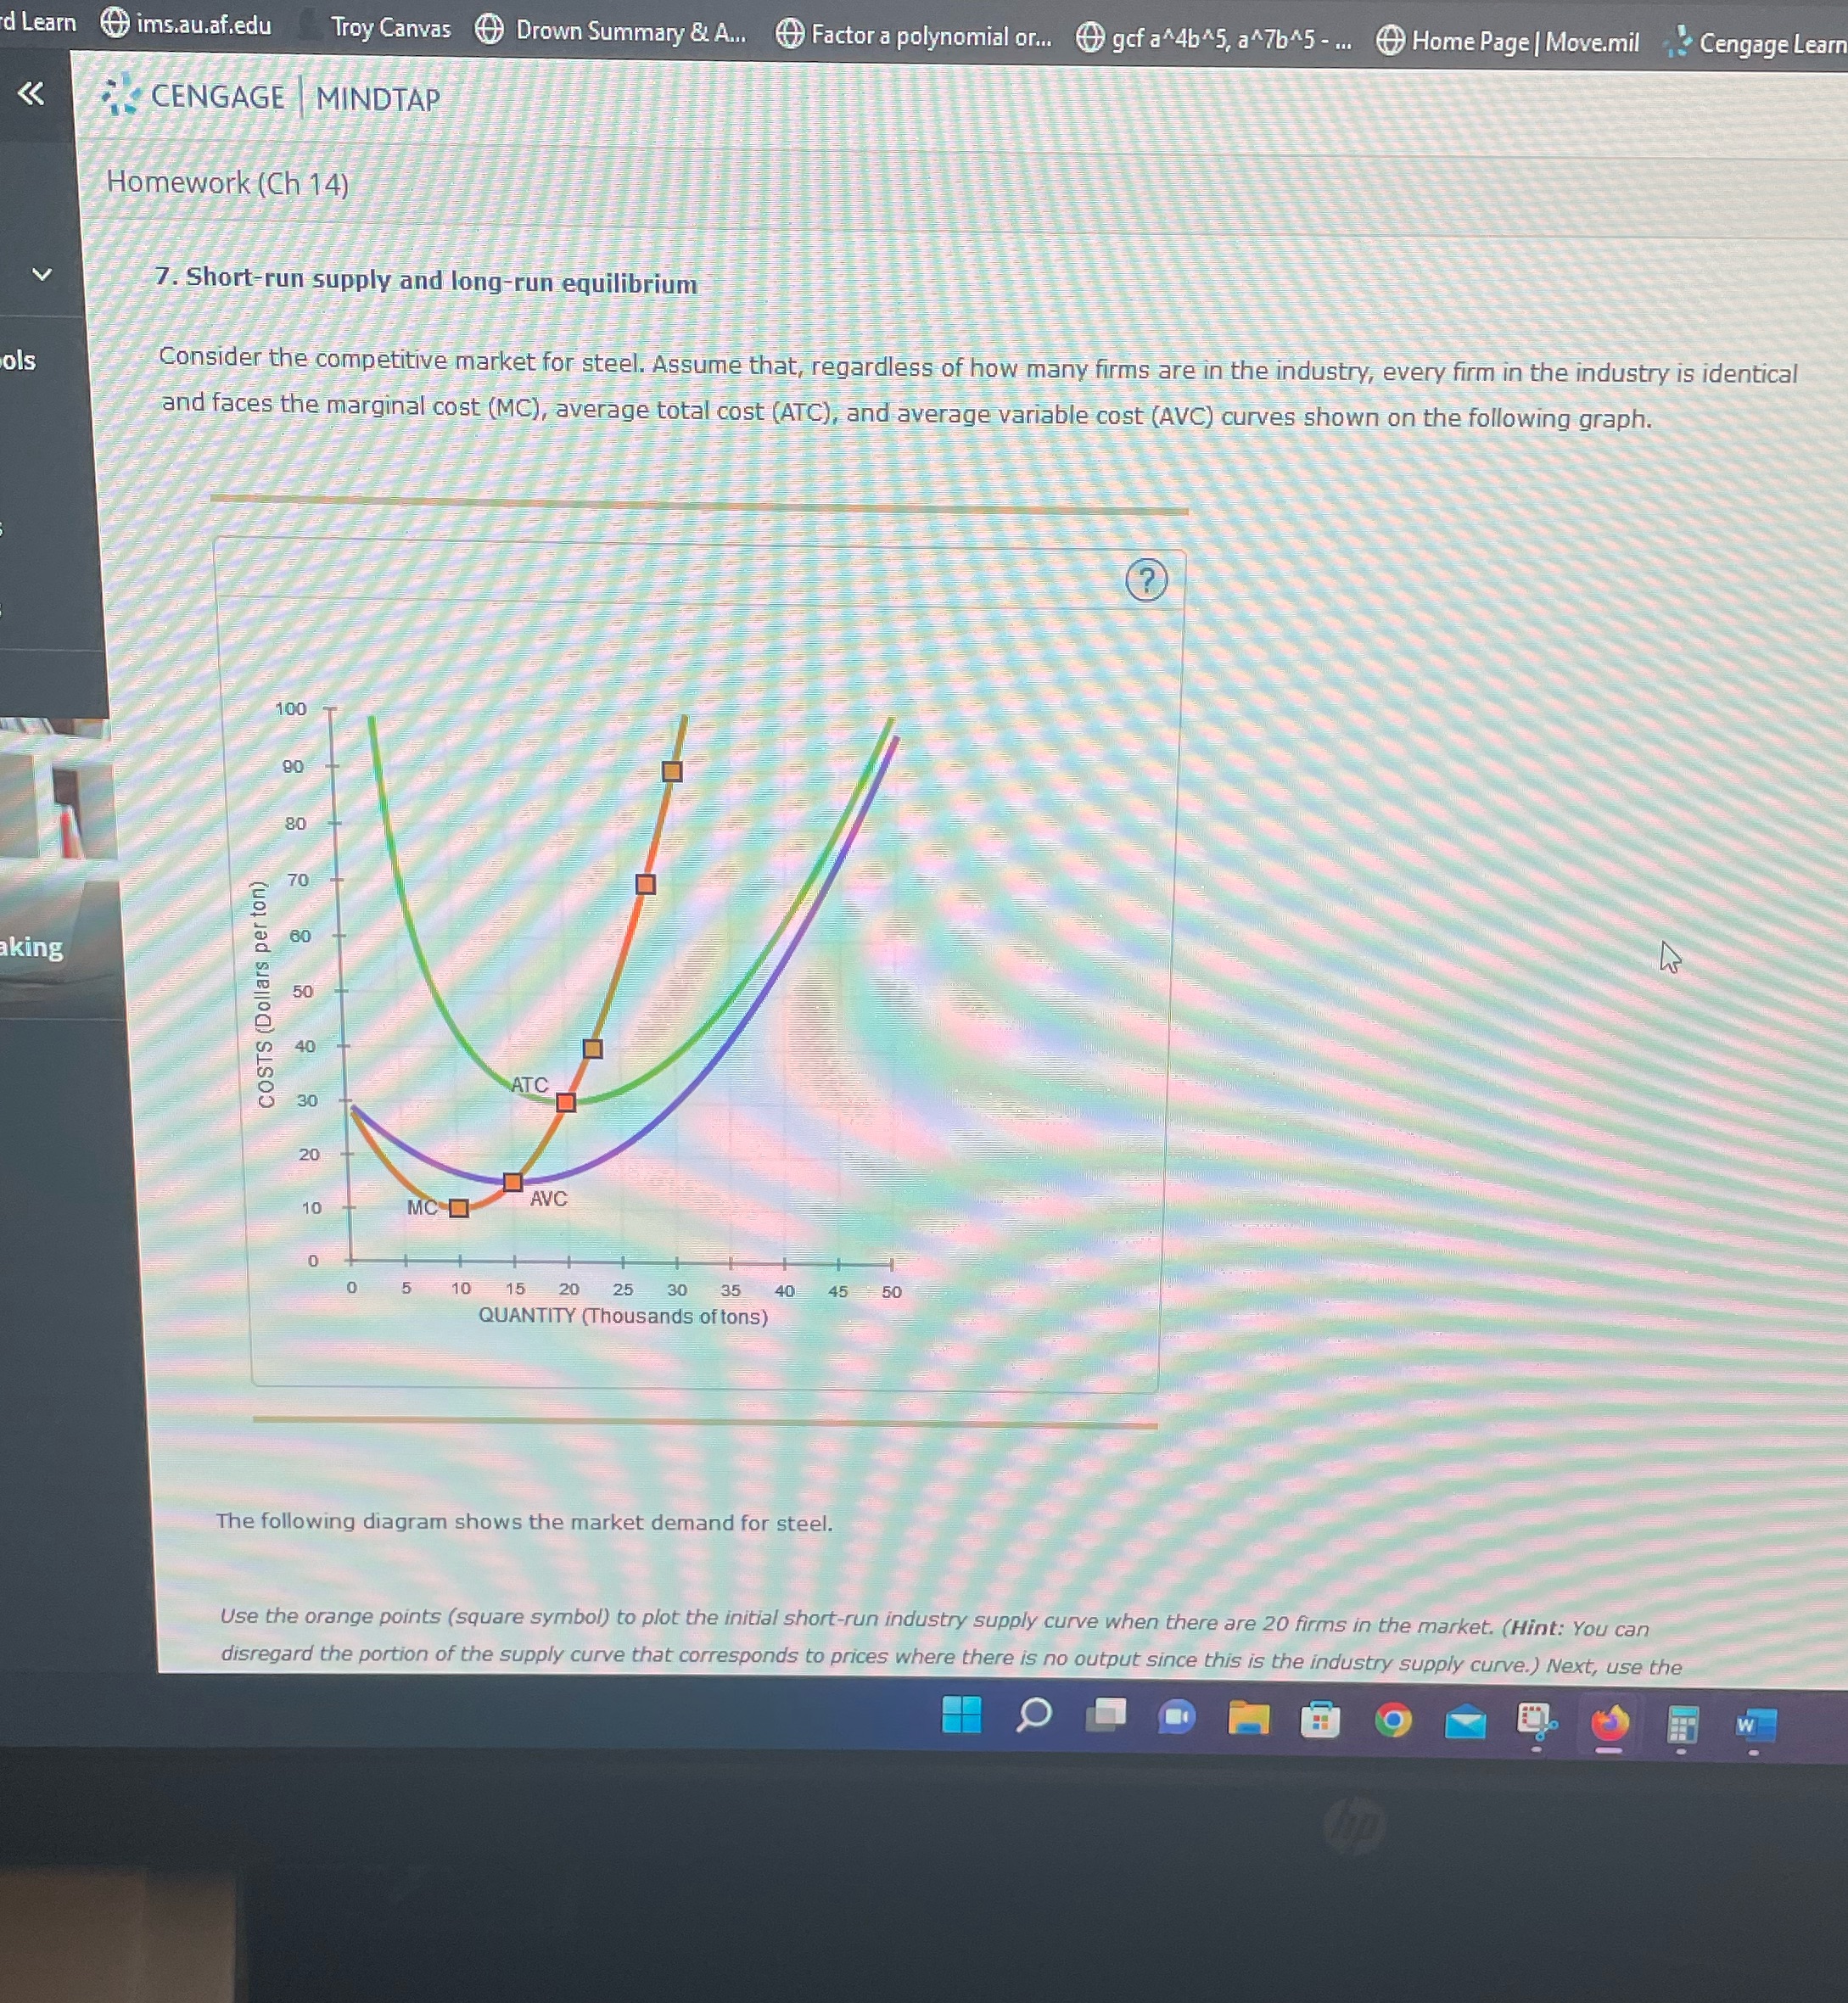
d Learn ims.au.af.edu Troy Canvas Drown Summary & A. Factor a polynomial or... (@gcf a^4b^5, a^7b45 -. @ Home Page | Move.mil Cengage Learn CENGAGE |MINDTAP Homework (Ch 14) 7. Short-run supply and long-run equilibrium ols Consider the competitive market for steel. Assume that, regardless of how many firms are in the industry, every firm in the industry is identical and faces the marginal cost (MC), average total cost (ATC), and average variable cost (AVC) curves shown on the following graph. 100 90 80 aking COSTS (Dollars per ton) ATC 20 10 MC AVC 10 15 20 25 30 35 40 45 50 QUANTITY (Thousands of tons) The following diagram shows the market demand for steel. Use the orange points (square symbol) to plot the initial short-run industry supply curve when there are 20 firms in the market. (Hint: You can disregard the portion of the supply curve that corresponds to prices where there is no output since this is the industry supply curve.) Next, use the W
Step by Step Solution
There are 3 Steps involved in it

Get step-by-step solutions from verified subject matter experts