

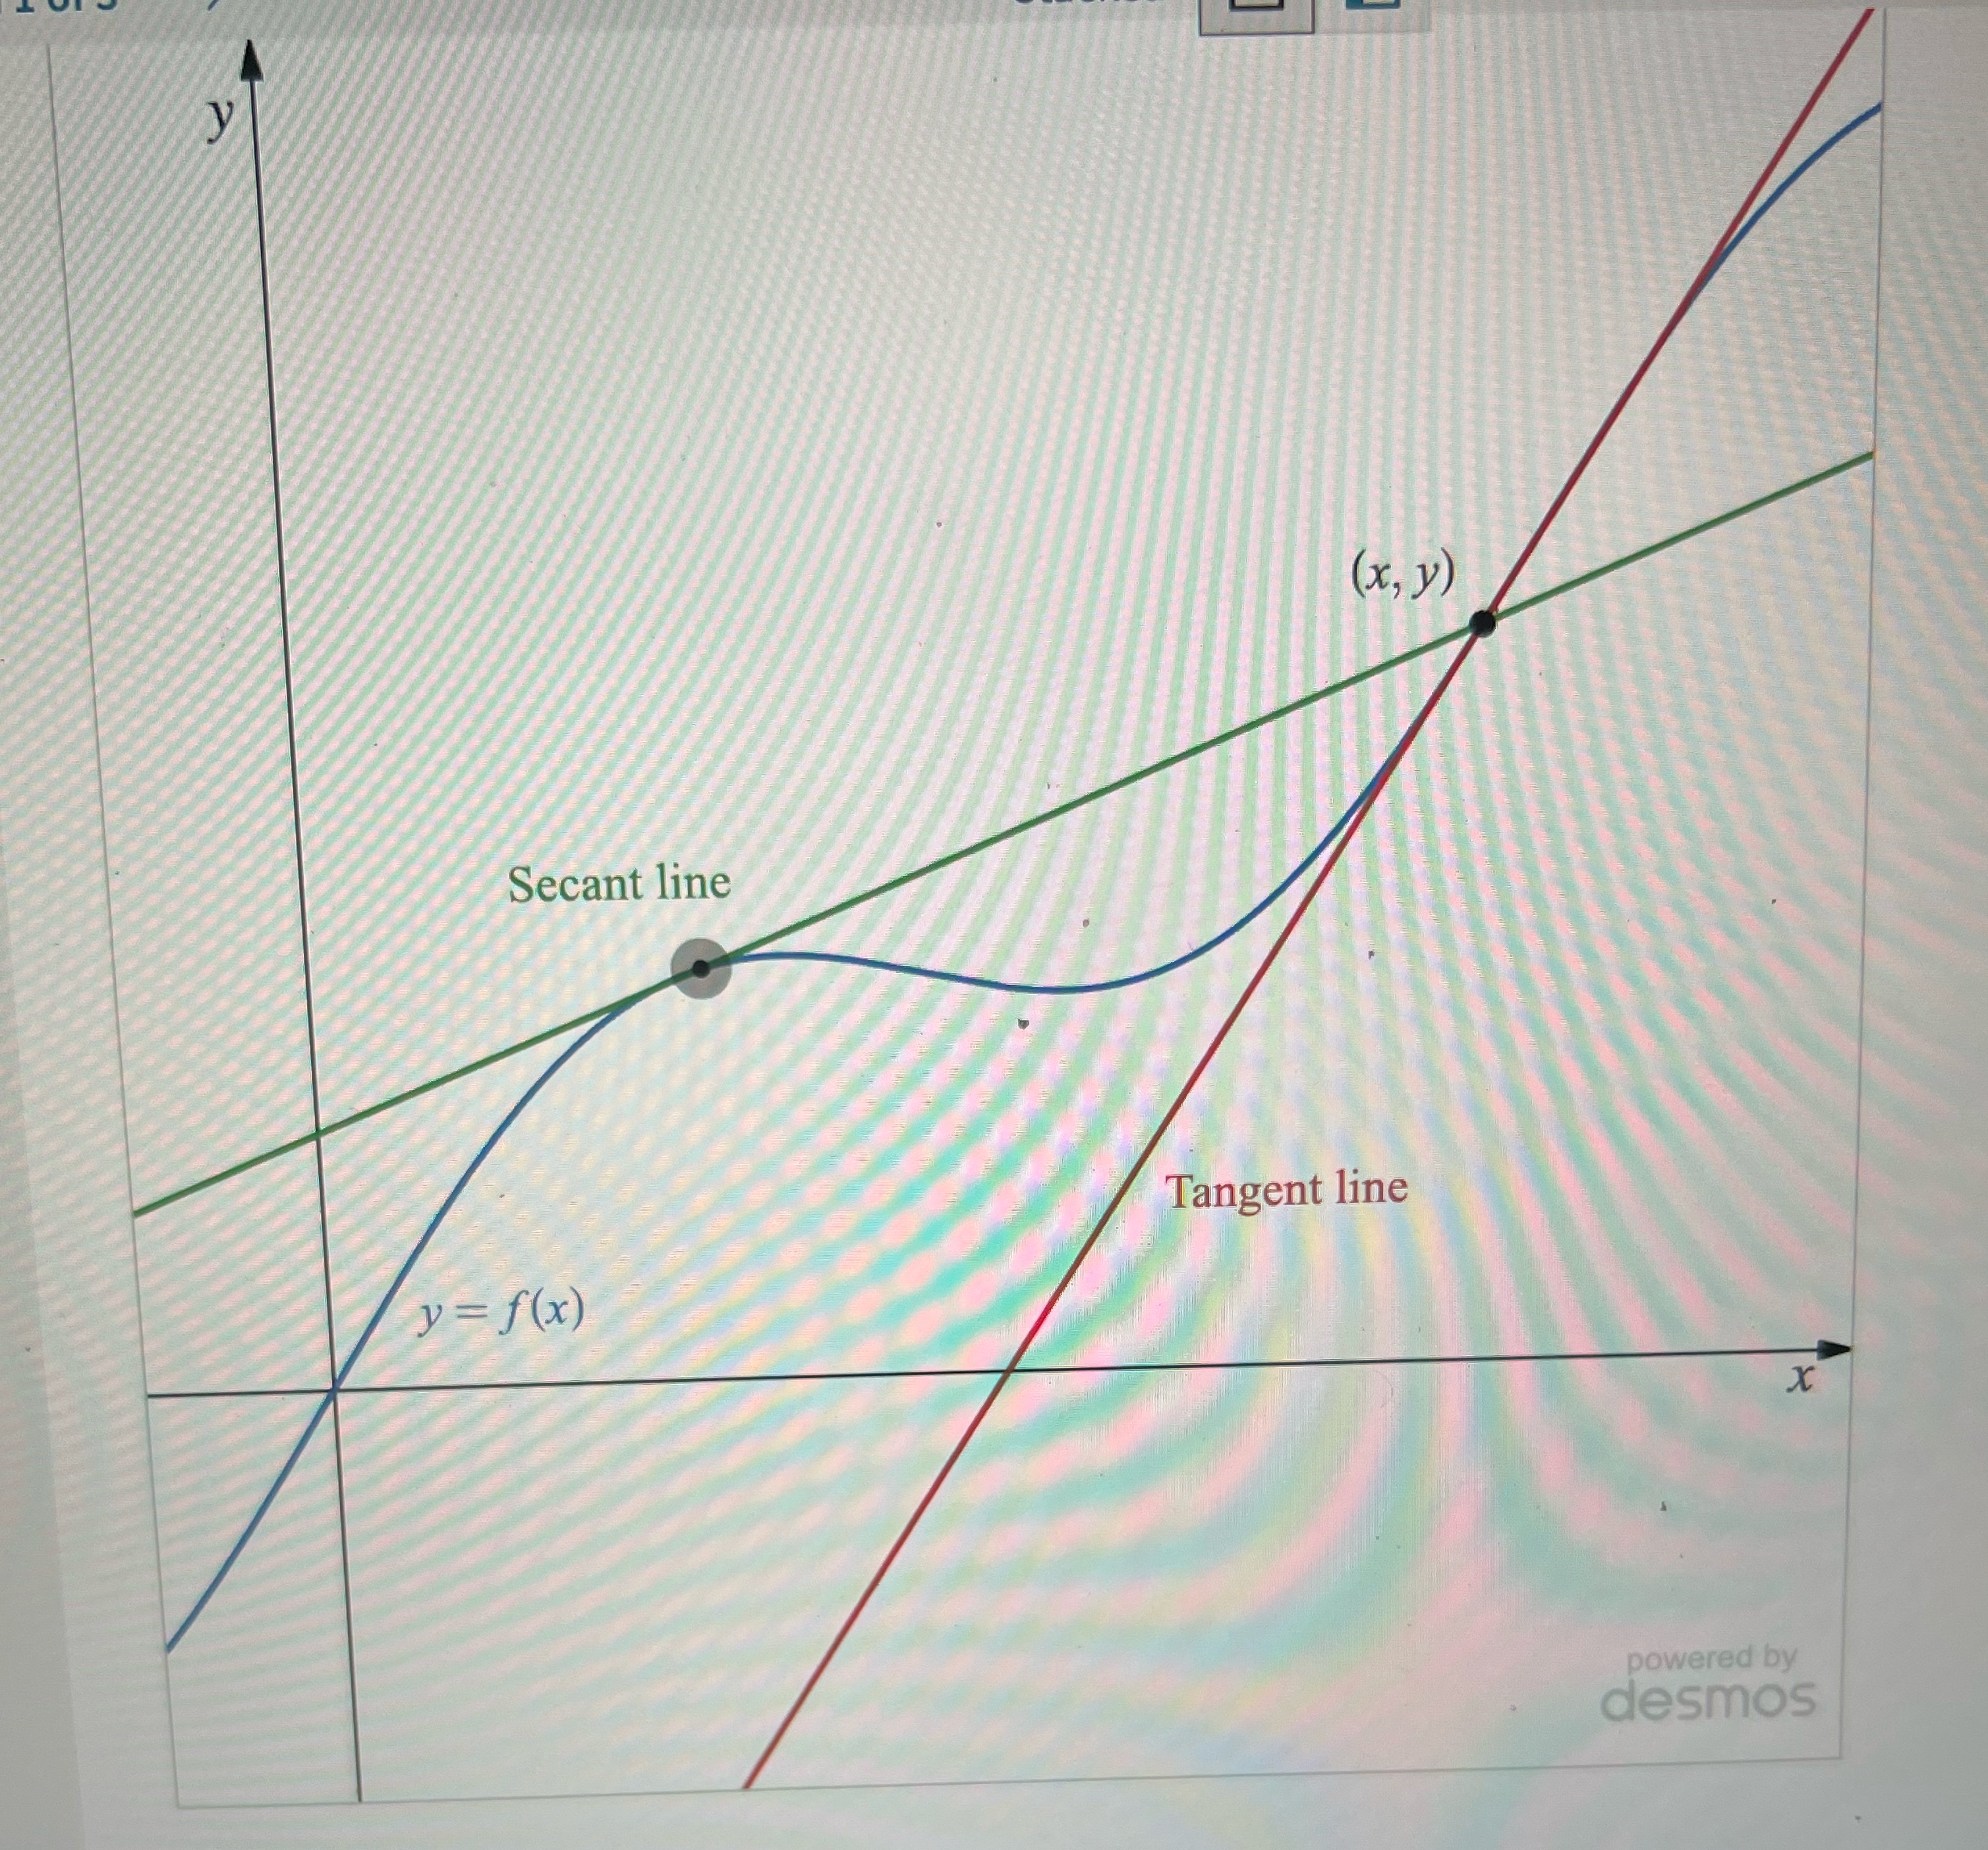
Question: This dynamic figure shows the tangent line to the function for different values of x. Drag the movable point along the curve to explore how
This dynamic figure shows the tangent line to the function for different values of x. Drag the movable point along the curve to explore how the slope of the tangent line varies.Which statement describes the tangent line at x = 0 ? A.The slope is and the tangent line is horizontal. B. The tangent line does not exist at 0.C. The slope is negative and the tangent line is decreasing.D. The slope is positive and the tangent line is increasingDescribe the slope of the tangent line of the function when x > 0. The slope is undefined. The slopes are both positive and sometimes negative. The slopes are positive since the function is increasing. The slopes are negative since the function is decreasing
Step by Step Solution
There are 3 Steps involved in it

Get step-by-step solutions from verified subject matter experts