

Question: This exercise builds upon functions in the Appendix, prior Excel tutorial exercises, tables & charts, and current concepts to demonstrate methods & algorithms, model construction,
This exercise builds upon functions in the Appendix, prior Excel tutorial exercises, tables & charts, and current concepts to demonstrate methods & algorithms, model construction, and analysis in forecasting.
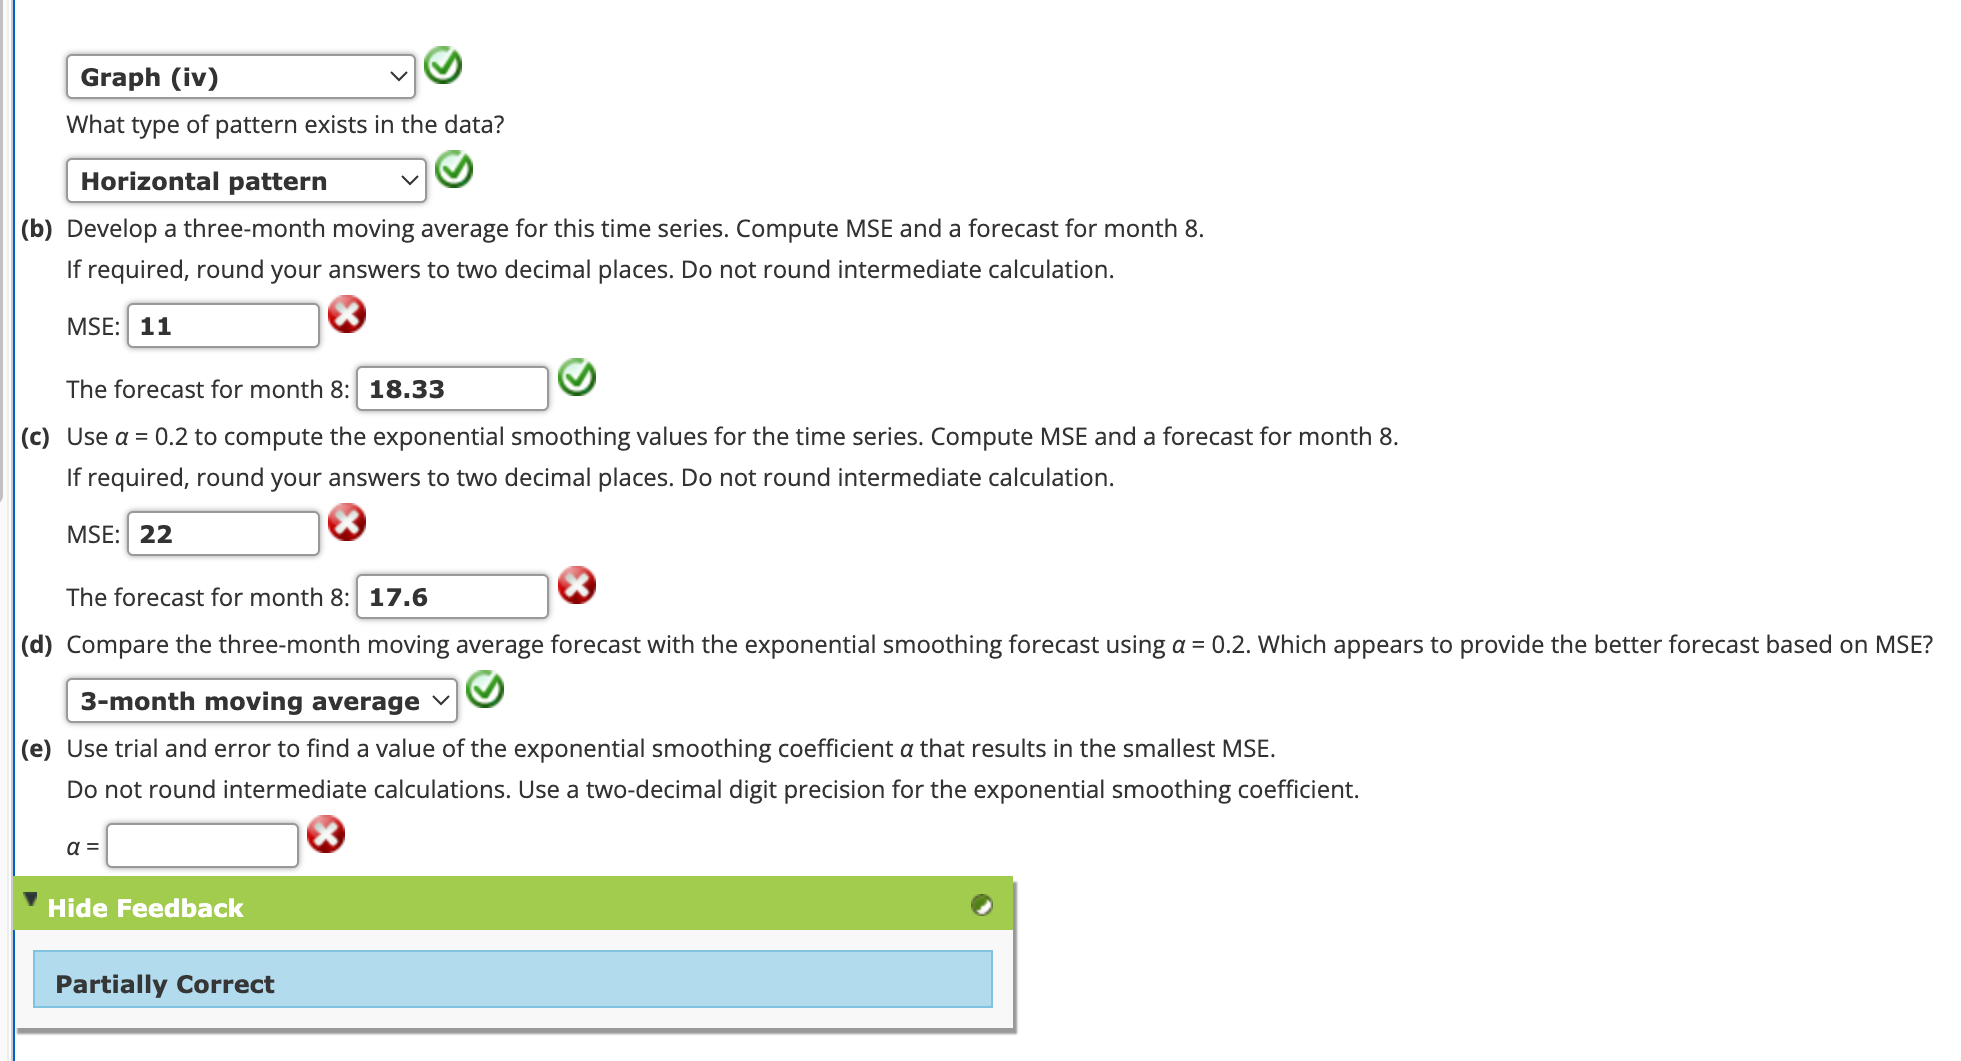
The exericise is based on the photo above: Question # Parts bcd Since you need to launch excel to work the problems, this lab's effort leverages work that you are already doing, while building competency in spreadsheet programming, model coding, and analysis.
Data to help solve question # in photo:
Month:
Value:
Workbook & Worksheet Configuation: In the Excel workbook, create a seperate worksheet for each problem; label the tab for questioCoding and Spreadsheet DSN: Create the tables or a single combined table on the Q worksheet for parts bc and d for questions Code the cells by hand in Q DO NOT use the analysis tool pack forecasting modules. NOTE: Code the worksheets to perform the forecasts. DO NOT enter in raw numbers based on hand calculations. No credit if coding not visible in formula view. However, it is suggested that student verify their understanding of the algorithm by performing a few "spot check" hand calculations and compare then Excel's results. Caution: Pay attention to the best practices for tables covered in Ch
Visualization Charts: Addendum: Develop a chart to compare the actual values to forecast values based on the moving average and exponential methods all on the same chart on the Q worksheet.
Clean Deliverables: Organize the workbook such that both the tables and the regression report on the worksheets are presentable and the spreadsheet design of each worksheet follows best practices. Remember best practices covered to date in the preceding labs, the assigned reading, and the lectures.
Highlights: Use YELLOW to highlight all the cells of the models and regression report that you referenced to answer parts bc & d of Q
Step by Step Solution
There are 3 Steps involved in it
1 Expert Approved Answer
Step: 1 Unlock

Question Has Been Solved by an Expert!
Get step-by-step solutions from verified subject matter experts
Step: 2 Unlock
Step: 3 Unlock