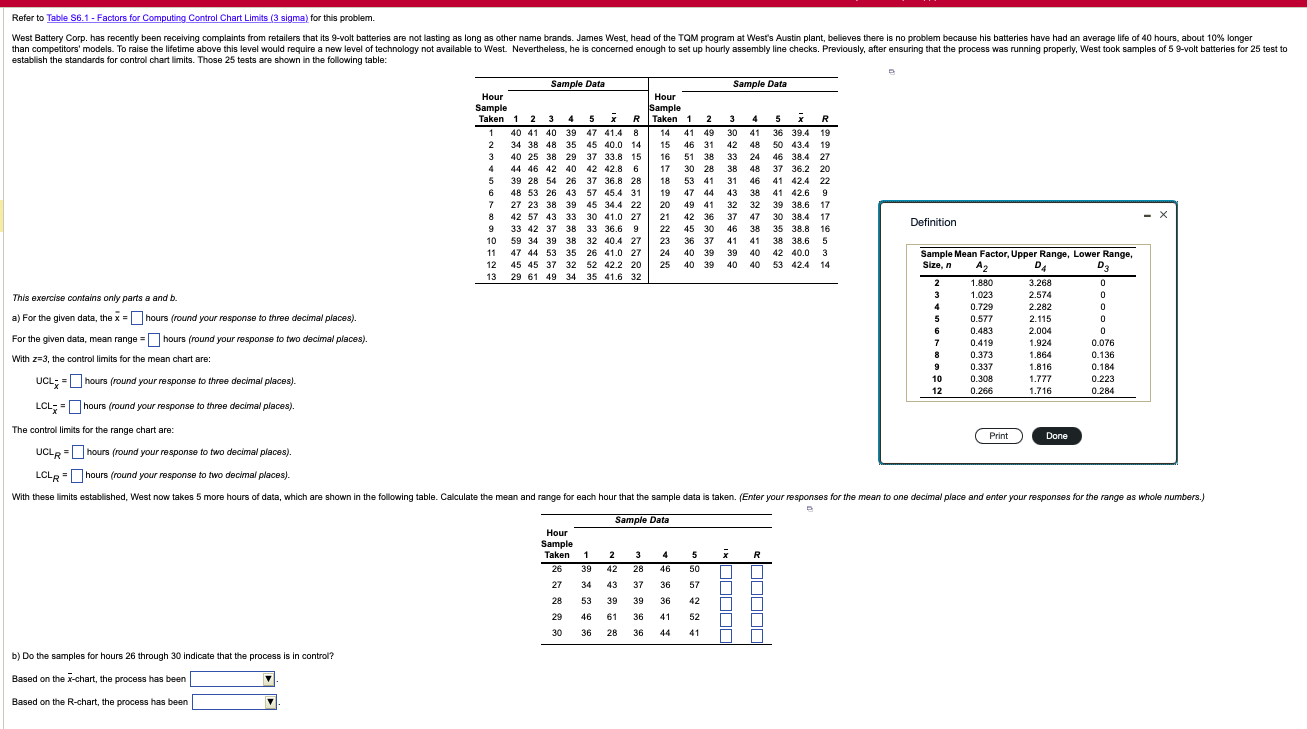
Question: This exercise contains only parts a and b. a) For the given data, the x= hours (round your response to three decimal places). For the

This exercise contains only parts a and b. a) For

This exercise contains only parts a and b. a) For the given data, the x= hours (round your response to three decimal places). For the given data, mean range = hours (round your response to two decimal places). With z=3, the control limits for the mean chart are: UCLx= hours (round your response to three decimal places). LCLx= hours (round your response to three decimal places). The control limits for the range chart are: UCLR= hours (round your response to two decimal places). LCLR= hours (round your response to two decimal places). With these limits established, West now takes 5 more hours of data, which are shown in the b) Do the samples for hours 26 through 30 indicate that the process is in control? Based on the x-chart, the process has been Based on the R-chart, the process has been

Step by Step Solution

There are 3 Steps involved in it

1 Expert Approved Answer
Step: 1 Unlock blur-text-image
Question Has Been Solved by an Expert!

Get step-by-step solutions from verified subject matter experts

Step: 2 Unlock
Step: 3 Unlock

Students Have Also Explored These Related General Management Questions!